Skip to content

Wissenschaftliche Arbeiten › MSc Dissertation

Distribution Sensitive Policy Analysis based on WELLBYs: Constructing a Prioritarian Social Welfare Function through Causal Evidence on Life Satisfaction

MSc Dissertation  |  LSE — Behavioural Science  |  2024  |  Supervised by Dr. Christian Krekel  |  Grade: 65%

Difference-in-Differences Panel Data Propensity Score Matching Stata Welfare Economics
Full Dissertation (PDF)
−0.0303 Points on a 0–10 life satisfaction scale — causal impact of Victoria's second COVID-19 lockdown (95% CI −0.049 to −0.012, p = 0.006). Harm concentrated disproportionately among those already worst-off (−0.334 additional points for those with LS < 4)
215,733 Observations (HILDA panel, 20 waves)
16,513 Individuals tracked over time
13.8M Prioritarian WELLBYs under lockdown
52.4M Prioritarian WELLBYs in Business-as-Usual

Research Context & Contribution

Standard policy analysis aggregates total welfare — it treats a unit of wellbeing gained by the richest and the poorest as morally equivalent. This dissertation challenges that assumption. Drawing on the Prioritarianism in Practice project initiated by Matthew Adler and colleagues, it constructs the first Prioritarian Social Welfare Function (SWF) using life satisfaction (WELLBYs) as the welfare measure.

The empirical application evaluates Victoria's second COVID-19 lockdown (July–October 2020) — one of the most stringent lockdowns outside China. By applying Difference-in-Differences to Australia's major household panel survey (HILDA), the study isolates the lockdown's causal effect on life satisfaction from the general pandemic context. This is, to my knowledge, the first study to causally identify the impact of a COVID-19 lockdown on life satisfaction.

The results are then fed into an Atkinson Social Welfare Function (with inequality-aversion parameter γ = 1) to formally compare the wellbeing consequences of the lockdown policy with a Business-as-Usual counterfactual. The comparison provides an evidence-based recommendation framed in terms that capture fairness to those worst-off — something a simple cost-benefit analysis cannot do.

Theoretical Framework: Why Prioritarianism?

From Utilitarianism to Prioritarianism

Policy evaluation has long been dominated by Utilitarianism, which maximises the sum of individual welfare. While tractable, this approach violates the Pigou-Dalton Axiom: it is morally indifferent to who receives a welfare gain, ignoring inequality. Behavioral economics provides substantial evidence that citizens are inequality-averse (Clark & D'Ambrosio, 2015; Hurley et al., 2020), justifying a policy framework that weights improvements for the worse-off more heavily.

Two alternatives satisfy the Pigou-Dalton Axiom: Egalitarianism (comparative fairness, relative wellbeing) and Prioritarianism (absolute wellbeing, independent of relative position). Prioritarianism is preferred for two reasons:

  • Separability Axiom: Rankings of wellbeing vectors are independent of unaffected individuals — practically, this allows focusing only on those affected by a policy, without needing to account for the entire population
  • Levelling-Down Objection: Egalitarianism can imply that equalising welfare by reducing the wellbeing of better-off individuals is morally good. Prioritarianism avoids this — a move from a scenario where some have 7 and some have 9 (unequal) to a scenario where all have 7 (equal) is not an improvement under Prioritarianism, because no one is made better off

The Atkinson Social Welfare Function

The Atkinson SWF implements Prioritarianism formally through a strictly concave and increasing transformation of individual wellbeing, giving greater weight to improvements for those with lower wellbeing:

Atkinson SWF (general form, γ > 0, γ ≠ 1)
Social WelfareAtkinson = ∑i=1N g(w(·)i) = ∑i=1N ½(1−γ) · w(·)i1−γ
Atkinson SWF (γ = 1, applied in this dissertation)
Social WelfareAtkinson, γ=1 = ∑i=1N ln(w(·)i)

Setting γ = 1 reduces the SWF to the sum of log-transformed life satisfaction scores. The logarithm is strictly concave: the same unit increase in life satisfaction contributes more to social welfare for a person at 3/10 than for a person at 8/10. This formally encodes the Prioritarian principle that improvements for the worse-off matter more. γ = 1 represents a moderate inequality-aversion — a balance between efficiency and equality.

WELLBYs as the Welfare Measure

A WELLBY (Well-Being Year) equals one point of life satisfaction for one person for one year, measured on a 0–10 Likert scale. WELLBYs are used as the welfare measure because: (1) asking citizens directly about their life satisfaction aligns with democratic principles, respecting individual judgements; (2) life satisfaction predicts key behaviours like voting; and (3) the Atkinson SWF requires ratio-rescaling invariance, which WELLBYs on a 0–10 scale satisfy, unlike positive-affine invariance required for Utilitarian SWFs.

Empirical Design: Difference-in-Differences on HILDA

Data: HILDA Panel Survey

The analysis uses 20 annual waves (2001–2021) of the Household, Income and Labour Dynamics in Australia (HILDA) survey — Australia's major household panel survey, initiated in 2001. Initial sample: 7,682 households; 2,153 additional households added in 2011 (top-up sample); re-interview rates rose from 87% (wave 2) to over 95% (wave 8+).

The treatment window is the 20th wave (2020), when over 90% of interviews were completed before end of October 2020. The sample was restricted to respondents who provided data in 2020 and who were exposed to the lockdown (Stage 3 mobility restrictions in their postcode):

236,099 Observations after exclusions
3,796 Treatment observations (360 individuals in Victoria)
232,303 Control observations (all other Australian states)

DiD Model Specification

The DiD design compares the change in life satisfaction over time in the treatment group (Victoria, August–November 2020) with changes in the control group (all other Australian states, same period). This isolates the lockdown's specific effect from the general pandemic effect.

Equation 1 — Main DiD Model
LifeSatisfactionit = α + β1 × Treatmentit + β2 × Year't + β3 × State'it + μi + εit
  • Treatmentit = 1 if individual i lived in a locked-down postcode in year t, 0 otherwise
  • Year't: year fixed effects (2019 as base year)
  • State'it: state fixed effects (Victoria as base)
  • μi: individual fixed effects (absorbs time-invariant person-specific variation)
  • β1: the causal treatment effect of the lockdown on life satisfaction
  • Estimated using reghdfe (Stata) with standard errors clustered at state level (8 clusters)
  • SCQ HILDA population weights applied throughout for representativeness

Parallel Trends Assumption

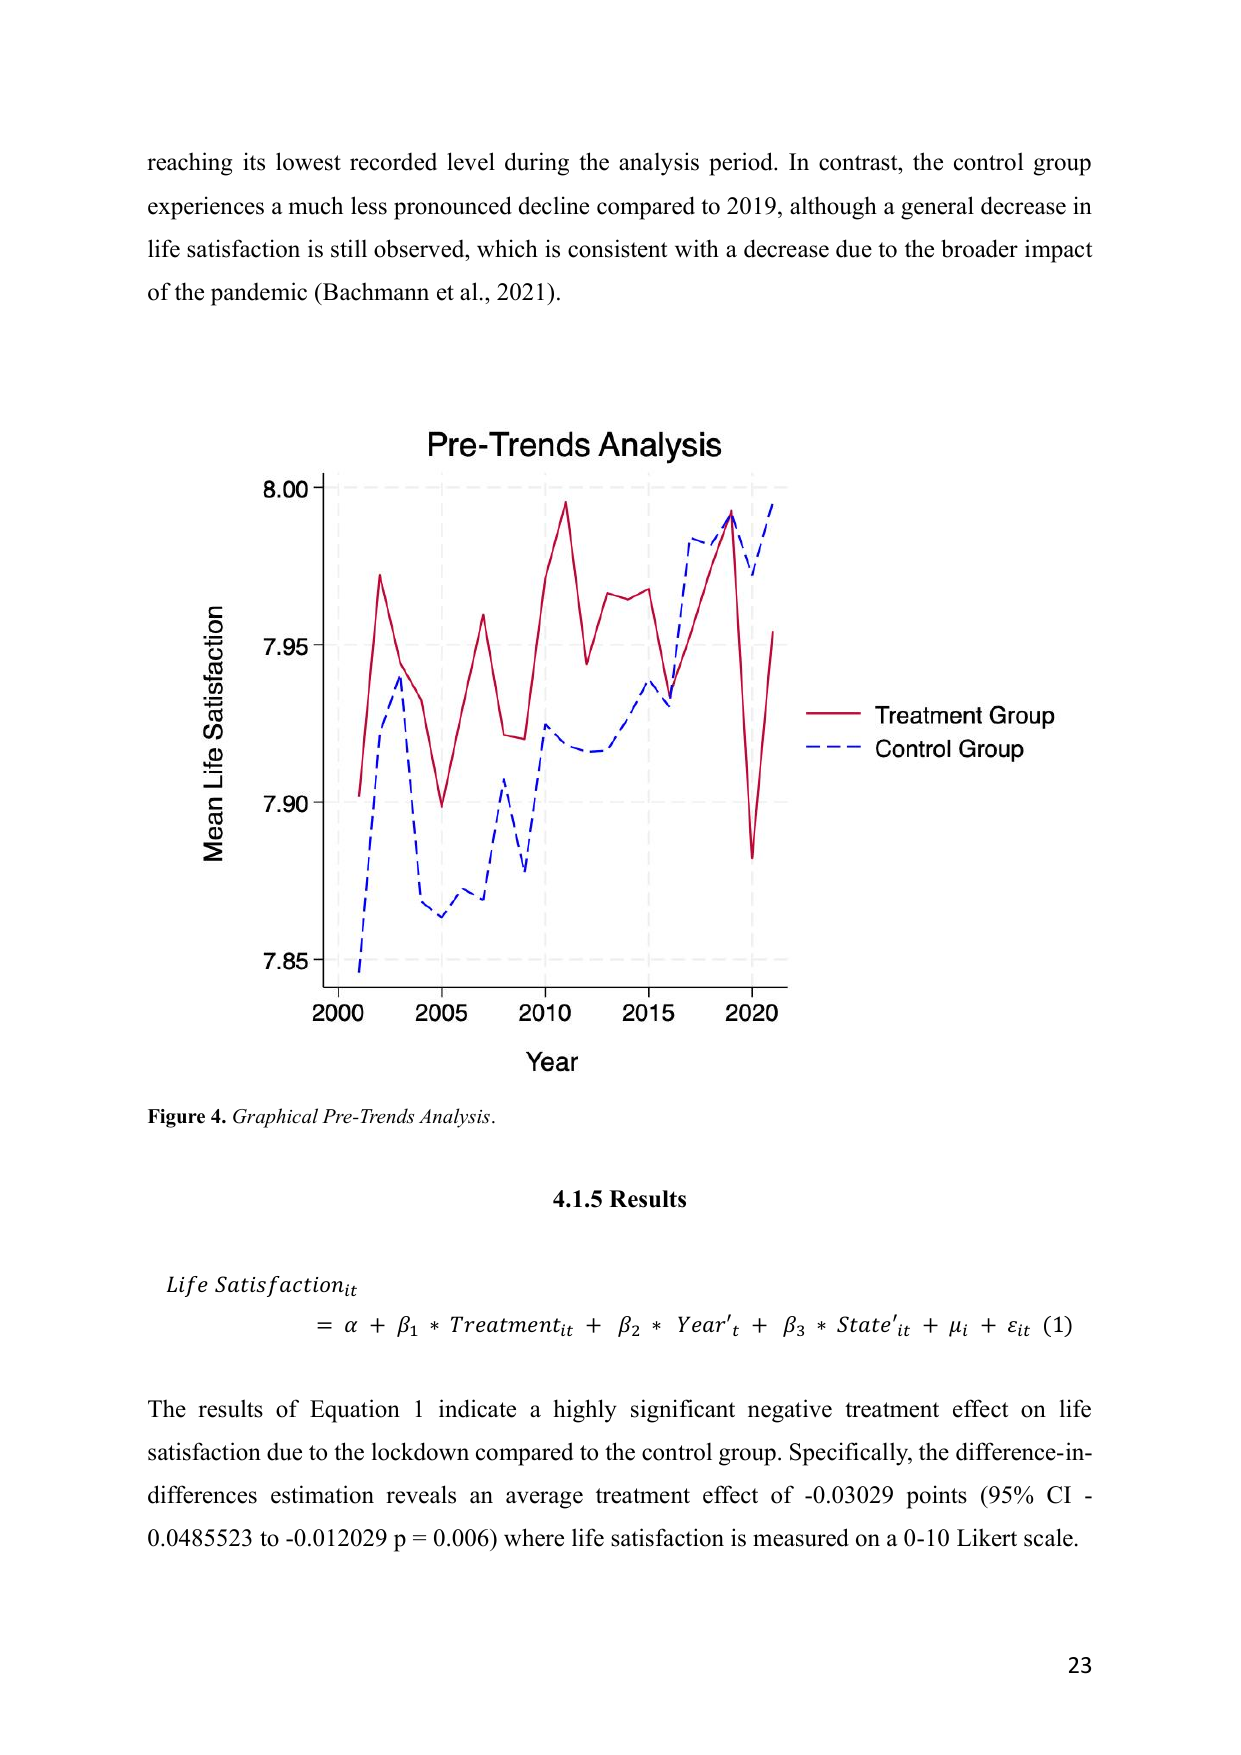
The DiD design requires that, absent the lockdown, life satisfaction in Victoria would have followed the same trajectory as in other Australian states. A graphical pre-trends analysis (Figure 4) plots mean life satisfaction for treatment and control groups from 2001 to 2019.

Figure 4
Pre-Trends Analysis: Mean Life Satisfaction 2001–2020
Pre-trends analysis: mean life satisfaction for Victoria (treatment) vs other states (control) 2001-2020

Treatment group (Victoria, red) and control group (other states, blue) track closely from 2001–2019, supporting the parallel trends assumption. In 2020 the treatment group drops sharply to its lowest recorded level — consistent with the lockdown effect.

Results: Three Models

Three models are estimated: Model 1 (overall effect), Model 2 (excluding COVID-diagnosed individuals to further isolate the lockdown policy effect from the direct health impact of infection), and Model 3 (stratified analysis comparing worst-off to better-off).

TABLE 1 — DiD Results: Impact of COVID-19 Lockdown on Life Satisfaction
Variable Model 1
Overall Effect
Model 2
Excl. COVID-19
Model 3
Stratified
Treatment (β1)
Causal lockdown effect
−0.0303***
(0.0077)
[−0.0486, −0.0120]
−0.0297***
(0.0080)
[−0.0487, −0.0106]
−0.0260**
(0.0103)
[−0.0505, −0.0013]
Group (life sat. < 4)
Worst-off indicator
N/A N/A −4.1795***
(0.0442)
[−4.2841, −4.0749]
Treatment × Group
Additional effect on worst-off
N/A N/A −0.3343***
(0.0175)
[−0.3756, −0.2929]
Constant 7.9022***
[7.9019, 7.9025]
7.9020***
[7.9016, 7.9023]
7.9528***
[7.9513, 7.9544]
Year Fixed Effects YesYesYes
State Fixed Effects YesYesYes
Individual Fixed Effects YesYesYes
Observations 215,733215,555215,733
State clusters 888
All models use SCQ HILDA population weights. Standard errors clustered at state level (adjusted for heteroskedasticity). Group = 1 for life satisfaction < 4 (threshold from ONS definition of "misery", Oman, 2016). *** p < 0.01, ** p < 0.05, * p < 0.10.

Model 1 establishes a highly significant average treatment effect: the lockdown reduced life satisfaction by 0.0303 points (p = 0.006). Model 2 virtually replicates this result after excluding COVID-positive individuals (−0.0297, p = 0.008), ruling out direct health impacts as a confounder. Model 3 reveals the distributional story: the interaction term (Treatment × Group) is −0.334*** — those with initial life satisfaction below 4 experienced an additional 0.334-point decline, on top of the average effect of −0.026. The lockdown was strongly regressive.

Distributional & Heterogeneous Effects

Stratified DiD analyses (in the appendix) reveal which groups were most harmed by the lockdown:

Worst-off (LS < 4)
−0.334***
Additional impact beyond average treatment effect. Lockdown's regressive core finding.
Low Mental Health (MHI ≤ 33)
−0.419*
Respondents with poor baseline mental health disproportionately affected.
Age 15–19
−0.095**
Youngest age group drove much of the average effect — most exposed to school closures and social restrictions.
Men
−0.081*
Significant for men; women showed a small, non-significant positive effect (+0.027).

These findings have direct implications for future intervention design: targeted mental health support for those with low baseline wellbeing and poor mental health would be warranted if lockdowns are ever repeated. The gender differential also warrants specific policy consideration.

Robustness: Propensity Score Matching

While DiD controls for time-invariant individual characteristics and common time trends, it does not account for time-varying observable differences between treatment and control groups. Propensity Score Matching (PSM) addresses this by creating a matched sample that is balanced on observed covariates likely to influence both lockdown exposure and life satisfaction.

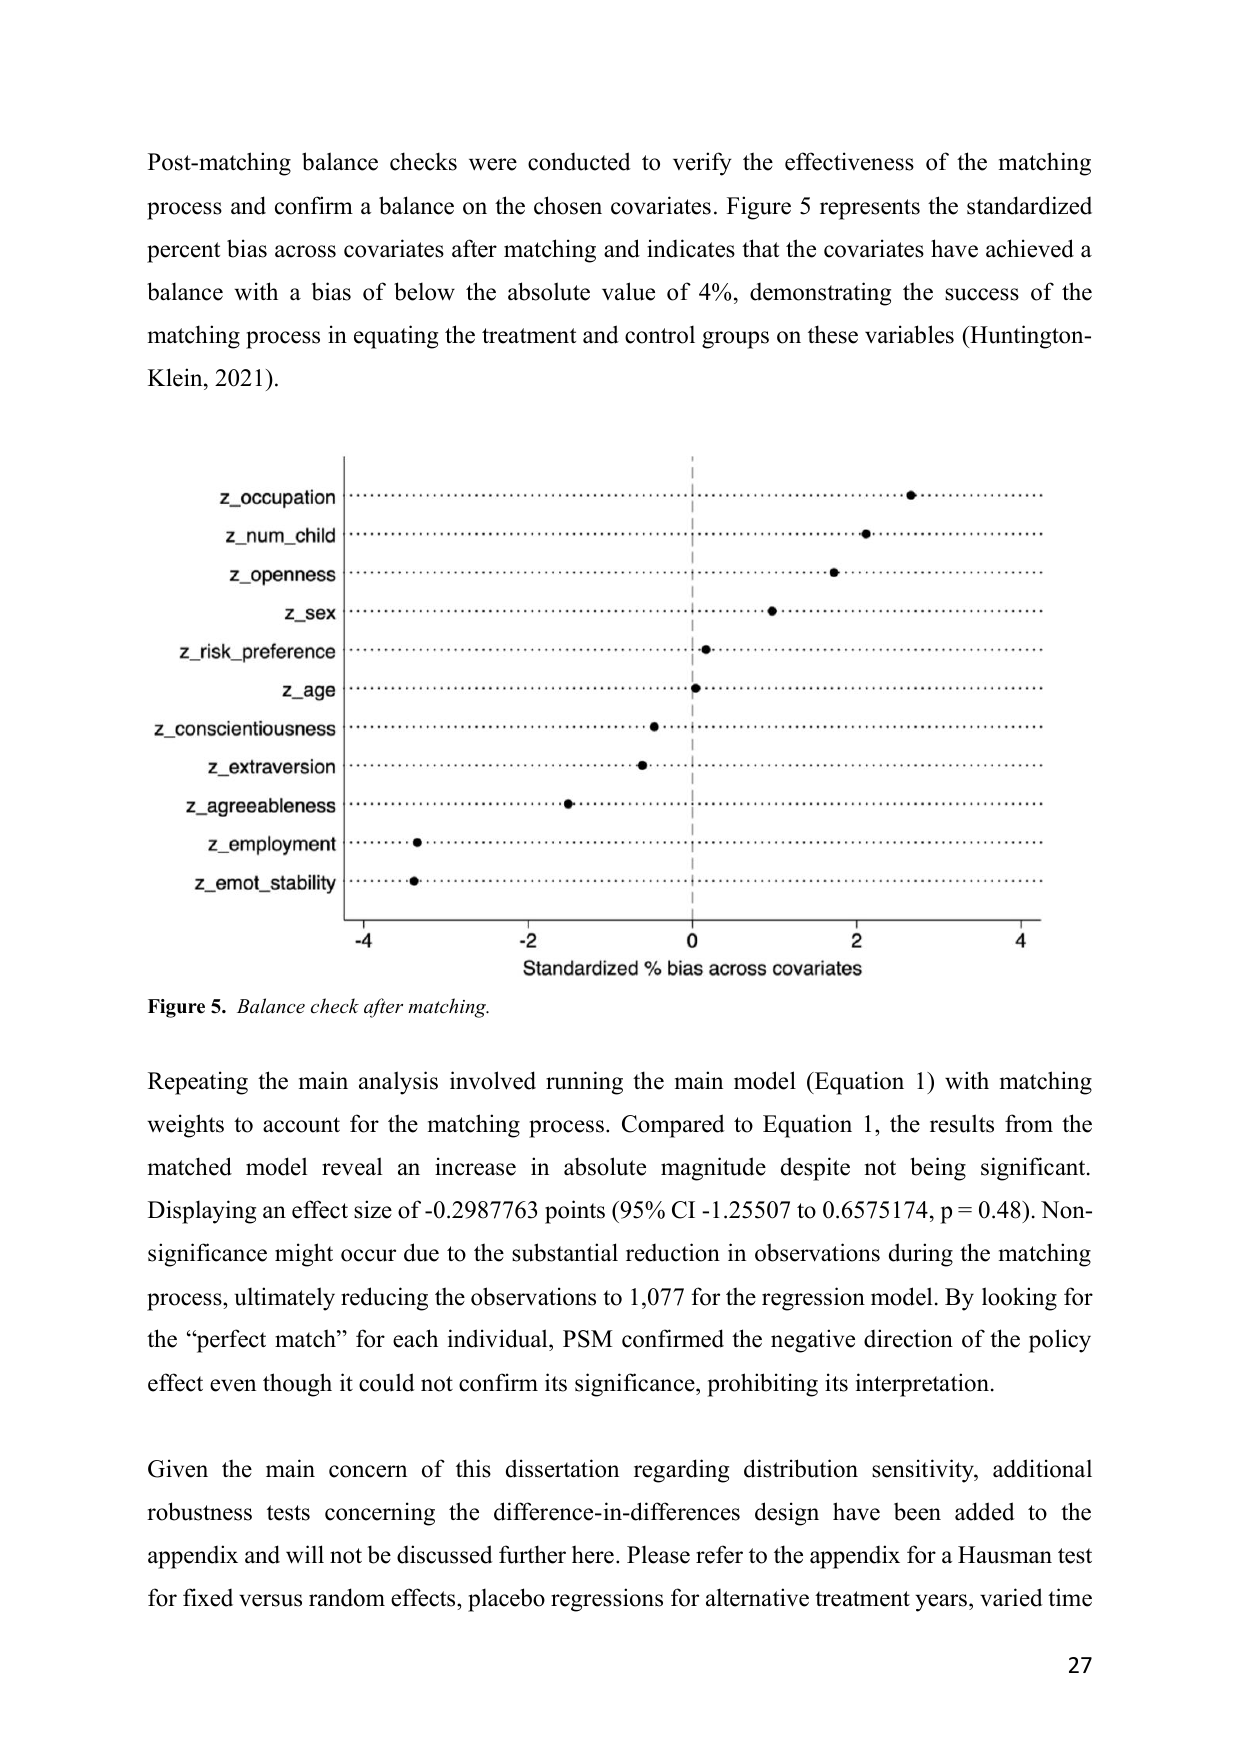
Covariates used for matching: Big Five personality traits (openness, conscientiousness, extraversion, agreeableness, emotional stability), risk preferences, age, sex, number of children, occupation, and employment status. All variables were standardised before logistic regression. Matching was performed using nearest-neighbour with a caliper of 0.05.

Figure 5
Balance Check after Propensity Score Matching
Standardised percentage bias across covariates after propensity score matching

Standardised % bias across all 11 covariates after nearest-neighbour PSM (caliper 0.05). All covariates below the 4% threshold — the matched sample is well-balanced on all observable characteristics.

PSM result: −0.299 points (95% CI −1.255 to 0.658, p = 0.48). The substantial sample reduction during matching (from 215,733 to 1,077 observations) severely reduces statistical power, preventing significance. However, the direction of the effect is consistent with the main DiD finding — PSM confirms the negative sign and cannot reject the main result.

Additional robustness checks in the appendix: Hausman test for fixed vs. random effects, placebo regressions for alternative treatment years, varied time windows, reverse causality test, and further stratified DiD analyses by age, gender, family type, and mental health baseline.
Prioritarian Welfare Comparison: Lockdown vs. Business-as-Usual

The DiD estimates are used to construct an Atkinson SWF (γ = 1) for two scenarios, comparing their Prioritarian WELLBYs to determine which policy yields greater social welfare when the worst-off receive priority weight.

1

Policy 1: Lockdown Scenario

Life satisfaction scores predicted from the main DiD model (Equation 1) for Victorian citizens. Predicted data, rather than observed data, is used to isolate the causal lockdown effect. Scores are scaled to the full Victorian population using SCQ survey weights, then transformed using the Atkinson SWF with γ = 1 (logarithmic transformation).

2

Policy 2: Business-as-Usual Scenario

Life satisfaction from the 2020 control group represents what Victorian citizens' wellbeing would have looked like without the lockdown policy (but still including broader pandemic effects). In addition, a Business-as-Usual scenario would have led to 44,756 additional deaths (applying a 0.67% mortality rate, Ferranna et al. (2022), to Victoria's 6.68 million population). These lost WELLBYs — calculated using a remaining lifetime of 6 years and an indifference point of 2 (Peasgood et al., 2018) — are subtracted from the Business-as-Usual welfare total.

Policy 1: Lockdown
13,775,625 Prioritarian WELLBYs
(Σ ln(LSi), lockdown predicted scores)
Policy 2: Business-as-Usual
52,366,212 Prioritarian WELLBYs
(control group scores − 44,756 COVID deaths)
Conclusion: The Prioritarian welfare comparison is unambiguous. The Business-as-Usual scenario yields 52.4 million Prioritarian WELLBYs versus only 13.8 million under the lockdown. Even accounting for the 44,756 additional deaths that would have occurred without the lockdown, the wellbeing cost of restricted social activities and heightened economic distress far outweighs the welfare loss from these additional deaths. Under a Prioritarian welfare framework, the lockdown policy is not preferable.

Welfare Function Specifications

Policy 1: Lockdown Social Welfare
Social WelfareLockdown = ∑i=1N ln(LSi) = 13,775,625 Prioritarian WELLBYs
Policy 2: Business-as-Usual Social Welfare (with COVID mortality)
Social WelfareBAU = ∑i=1N−D ln(LSi) − ∑j=1D (ln(LSj,deceased) − Ij,deceased) × Yj,deceased = 52,366,212 Prioritarian WELLBYs

Where: D = 44,756 (estimated additional deaths); I = 2 (indifference point between life and death, Peasgood et al. 2018); Y = 6 (remaining lifetime in years, Layard et al. 2020); γ = 1 (moderate inequality-aversion parameter).

Policy Implications & Limitations

Policy Implications

  • A case for distributional policy evaluation: This dissertation provides a practical template for constructing Prioritarian SWFs using life satisfaction. Switching from Utilitarian cost-benefit analysis to Prioritarian SWFs would systematically favour policies that do not impose regressive wellbeing burdens on the worst-off
  • Targeted interventions for future lockdowns: The regressive distribution of lockdown effects — concentrated in those with low life satisfaction, poor mental health, young people (15–19), and men — calls for targeted complementary interventions. Digital mental health tools, income support, and outreach for the worst-off should accompany any future lockdown decision
  • The lockdown decision reconsidered: Under a Prioritarian framework, the wellbeing cost of Victoria's second lockdown substantially exceeded the wellbeing benefit from prevented deaths. This does not mean lockdowns are always wrong — context matters — but it does highlight that standard public health analysis, which focuses exclusively on mortality, systematically underweights the diffuse wellbeing harms to the living
  • Governance implications: Life satisfaction significantly predicts electoral outcomes (Ward, 2019). Governments that allow large, concentrated wellbeing declines among vulnerable groups risk electoral consequences beyond the immediate policy debate

Key Limitations

  • Small treatment group: Only 360 individuals in the Victorian treatment group, limiting statistical power particularly for PSM
  • Cardinality of life satisfaction: The Atkinson SWF requires cardinal comparability of the 0–10 scale across individuals. While the literature provides strong theoretical and empirical arguments for treating the scale cardinally (Layard & De Neve, 2023; Peasgood et al., 2018), this remains contested
  • Business-as-Usual mortality assumptions: The 0.67% mortality rate (Ferranna et al., 2022) is conservative — it applies to a pre-vaccination scenario. Alternative assumptions would shift the welfare comparison
  • SWF framework limitations: The SWF is Welfarist (only wellbeing matters) and Consequentialist (morality determined by outcomes). Critics including Amartya Sen (1979) note these assumptions neglect justice, rights, and procedural fairness
  • External validity: The lockdown was specific to Victoria, Australia in a particular epidemiological and socioeconomic context. Results may not generalise directly to other settings