Skip to content

Wissenschaftliche Arbeiten › Quantitative Politikanalyse

The Effect of Cash Transfers on Political Support

Replication and Extension of Manacorda, Miguel & Vigorito (2011) — AEJ: Applied Economics
LSE — Quantitative Methods  |  2024  |  Grade: 83% — Distinction

Regression Discontinuity Design Stata Causal Inference Robustness Testing Policy Evaluation
Full Report (PDF) Research Poster
~10% Causal increase in political support for Uruguay's incumbent government among PANES cash transfer recipients — robust across OLS, donut-hole, bandwidth sensitivity, and local polynomial specifications
0.1096*** Effect on gov. support 2007 (OLS linear)
0.0998** Persistent effect post-program (2008)
0.1515*** Effect on confidence in MIDES
0.4111 McCrary test p-value (no manipulation)

Research Context

Manacorda, Miguel & Vigorito (2011) investigate whether Uruguay's PANES anti-poverty programme — a cash and food-card transfer to the poorest households — causally increased political support for the incumbent centre-left government. This replication uses a similar dataset covering ±0.02 around the eligibility cutoff and reconstructs the full empirical pipeline from scratch in Stata.

PANES (Plan de Atención Nacional a la Emergencia Social) ran from 2005 to 2007 and targeted households below a predicted income score threshold. Participants were surveyed at programme start (2005), 18 months into the programme (2007), and one year after it ended (2008). Self-reported political support was measured as a preference comparison of the incumbent government relative to the previous one.

The key question: does receiving a government transfer causally shift political loyalty toward the distributing government? This has first-order implications for how democratic governments deploy social spending and whether welfare programmes function as electoral tools.

Identification Strategy: Sharp RDD

The core identification challenge is that PANES eligibility is correlated with poverty and pre-existing political preferences — a simple comparison of recipients and non-recipients would be biased. The Regression Discontinuity Design (RDD) solves this by exploiting the sharp eligibility rule: households below the predicted income score cutoff (set to 0 after centring) received treatment, while those just above did not.

Near the cutoff, assignment is as good as random — households just below and just above the threshold are virtually identical in all baseline characteristics. This local quasi-randomisation yields an unbiased estimate of the Local Average Treatment Effect (LATE) for households around the poverty threshold.

The full analysis pipeline in Stata:

1

Visual inspection & histograms

Plotted binned means of government support by income score (Figure 1) to confirm a visible discontinuity at the cutoff. Discrete and continuous histograms of the running variable checked for heaping (Figures 2–3).

2

McCrary density test

Formal test for manipulation of the running variable. A significant density jump at the cutoff would suggest households strategically selected into treatment — invalidating the RDD. Result: p = 0.4111, no evidence of manipulation.

3

Placebo regressions on pre-treatment covariates

Regressed baseline characteristics (gender, age, education, income) on treatment status. If the RDD is valid, no pre-treatment covariate should jump at the cutoff. One exception: mean household size showed a significant jump (p<0.05), which was thereafter included as a control.

4

Main OLS regressions (linear & polynomial)

Estimated the treatment effect on government support in 2007 (during PANES) and 2008 (after PANES), using linear and second-order polynomial specifications, with and without controls for household size.

5

Donut-hole robustness checks

Excluded observations within ±0.005 and ±0.002 of the cutoff to test sensitivity to potential heaping. If results hold after removing the most suspicious near-cutoff observations, confidence in the estimate increases.

6

Local polynomial regressions (bias-corrected, rdrobust)

Applied nonparametric local polynomial regression using the rdrobust package with optimal bandwidth selection (MSERD and MSETWO algorithms) and Epanechnikov kernel weighting to down-weight observations far from the cutoff.

7

Bandwidth sensitivity analysis

Plotted treatment coefficients at bandwidths of 0.005, 0.01, 0.015, and 0.02 to verify stability. A bandwidth-sensitive result would raise external validity concerns.

Step 1 & 2: Continuity of the Running Variable

Visual Discontinuity Check

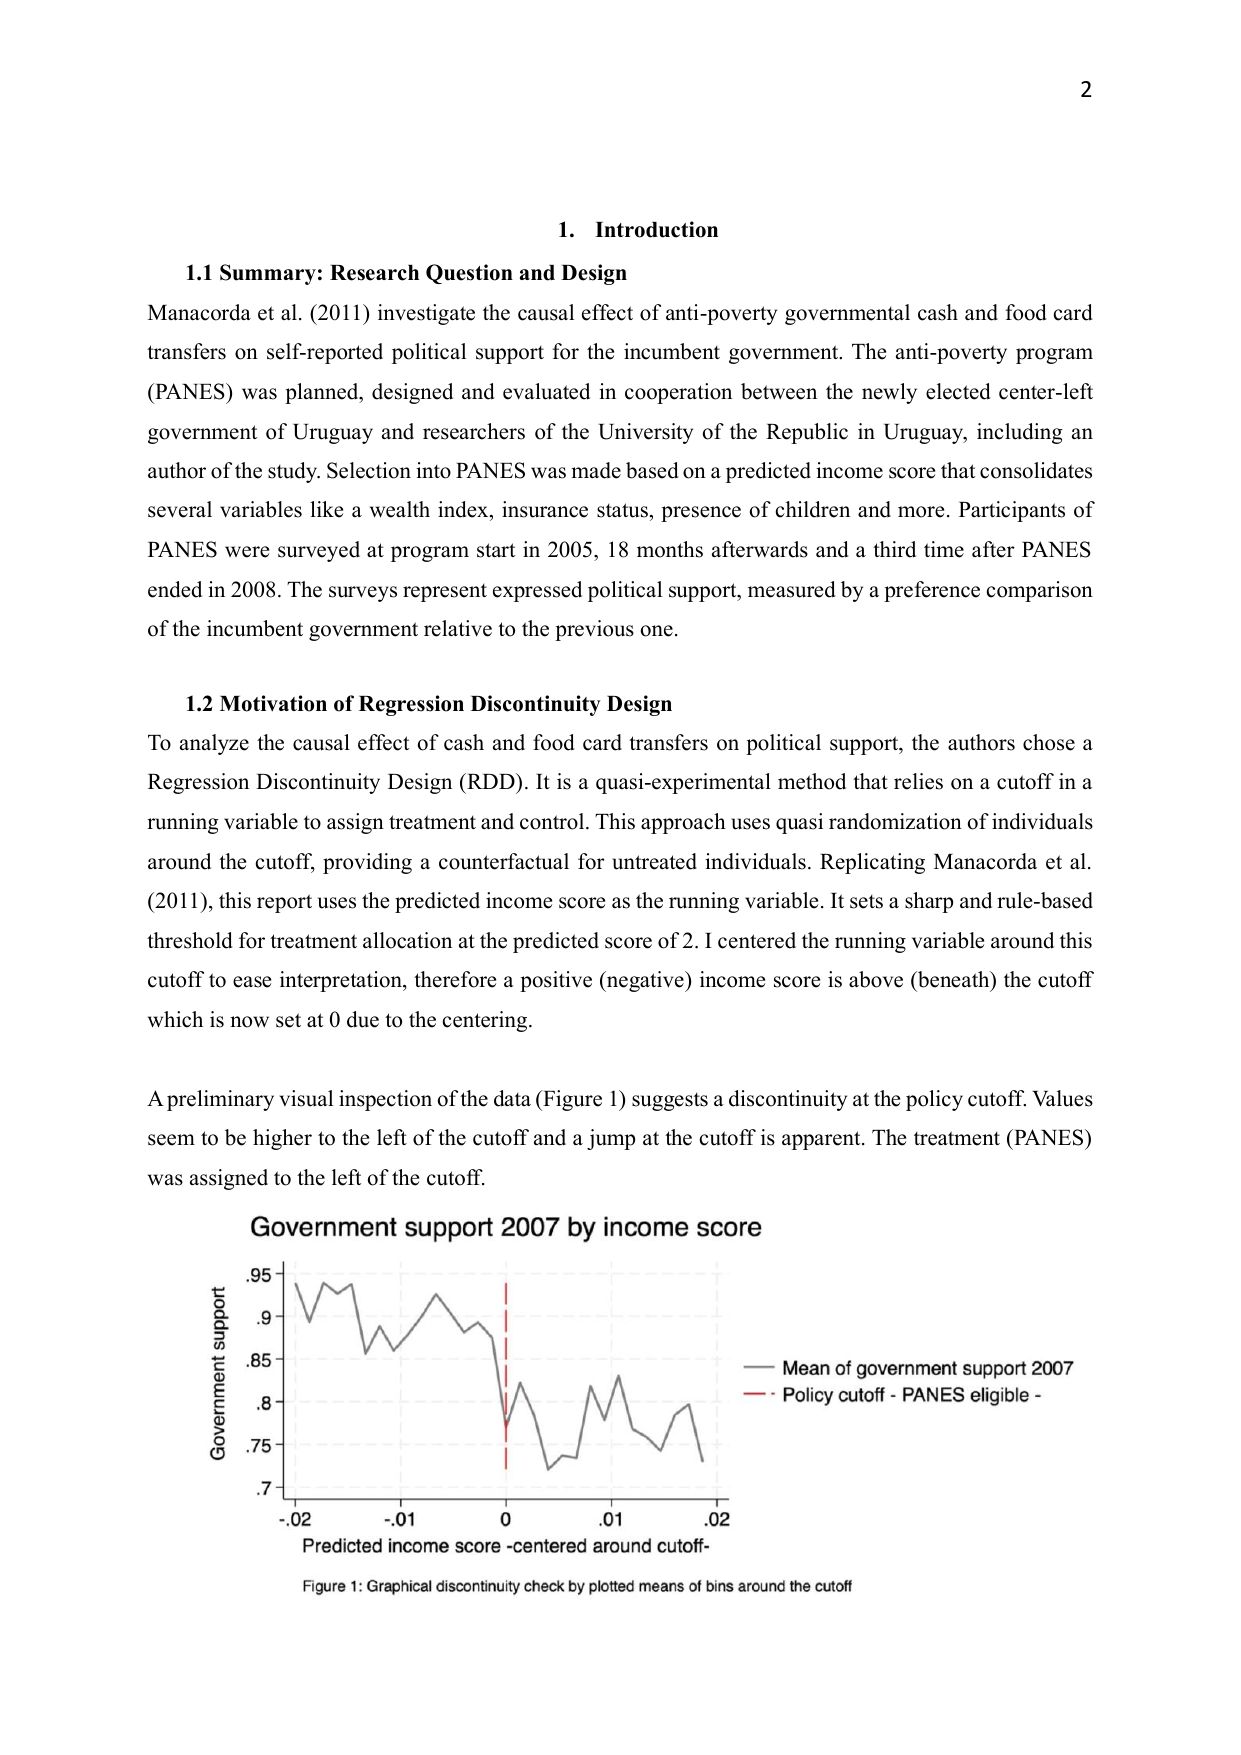
A preliminary plot of binned mean government support by income score (Figure 1) immediately reveals a visible jump at the cutoff — the first piece of evidence that PANES eligibility affects political support. This visual inspection motivates the full regression analysis.

Figure 1
Government Support 2007 by Income Score
Government support 2007 by income score — scatter plot showing jump at cutoff

Binned means of government support by predicted income score centred at the cutoff. Values left of zero (PANES-eligible) are visibly higher, with a clear discontinuity at the threshold.

McCrary Density Test

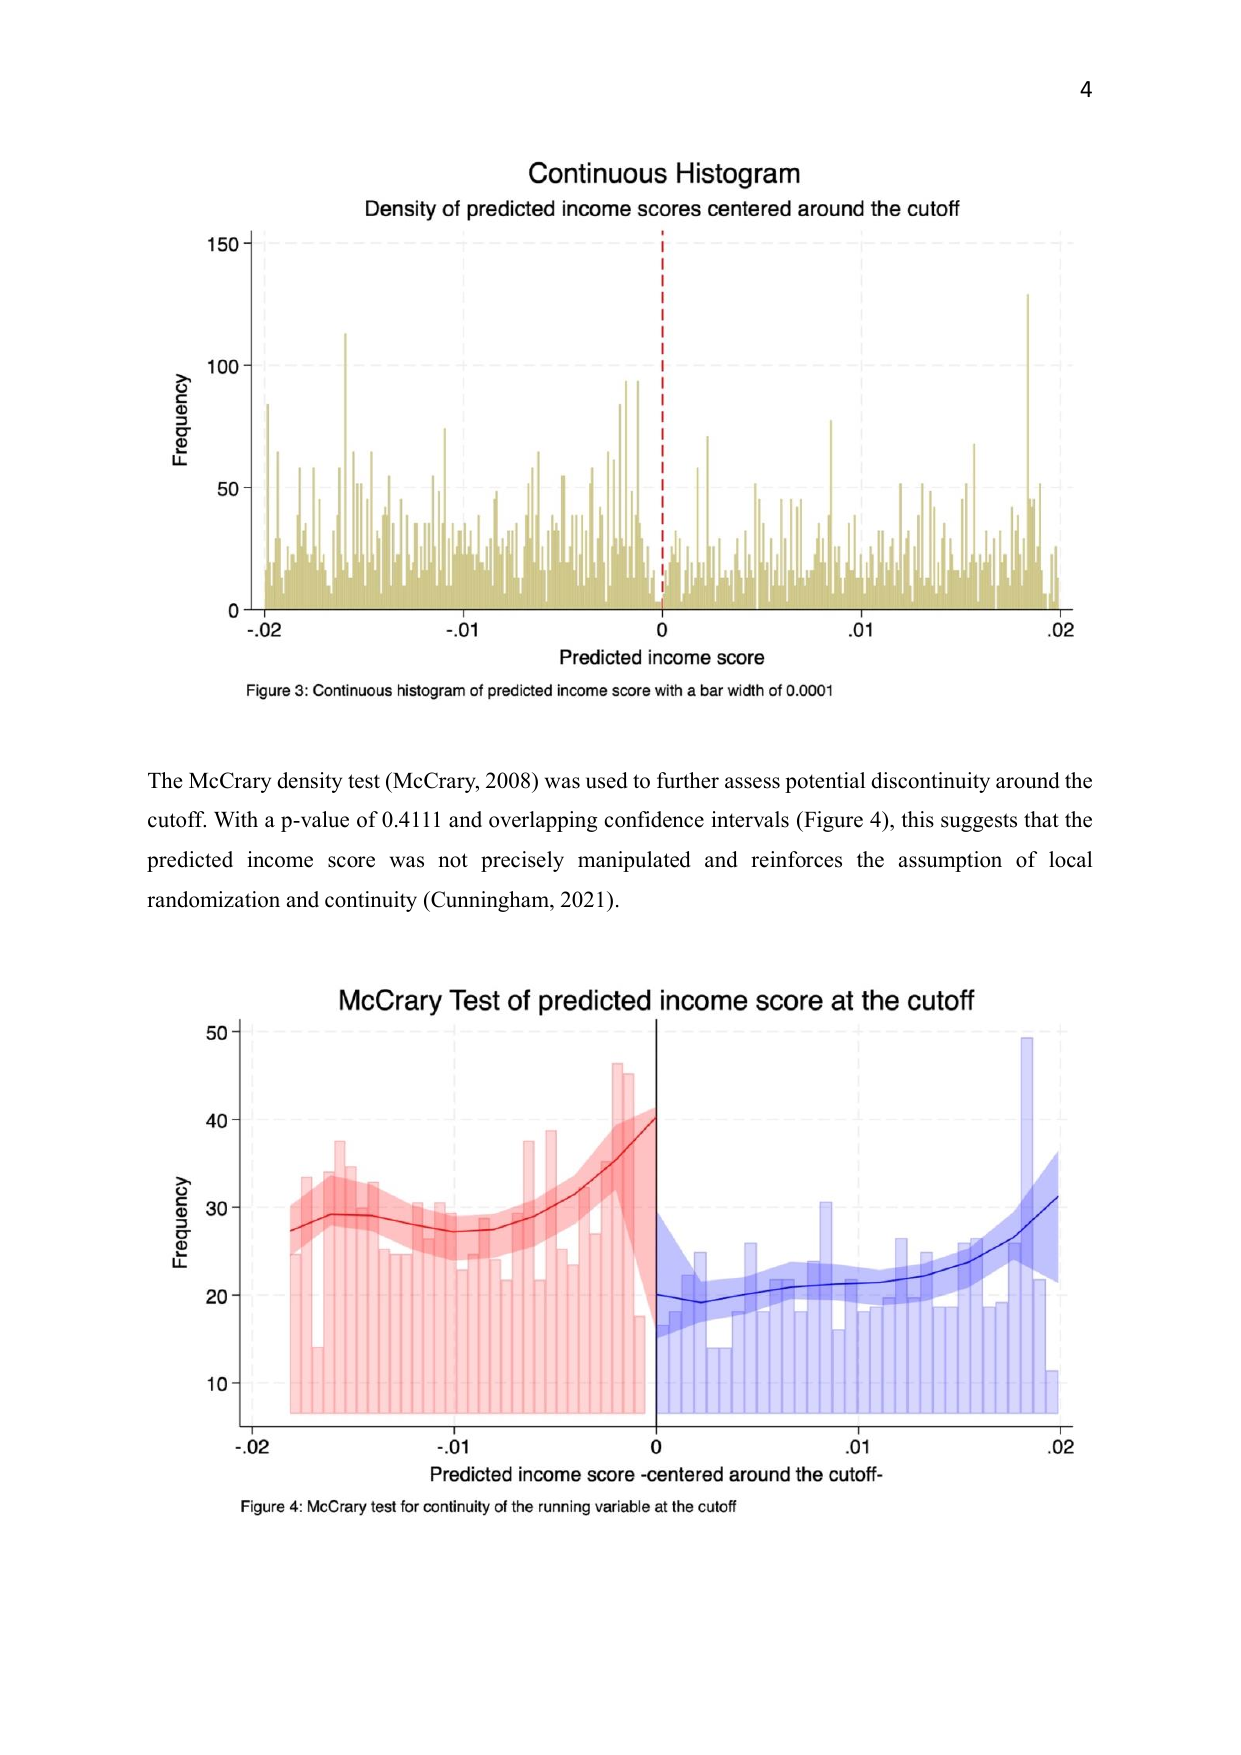
The McCrary test (McCrary, 2008) formally tests whether the density of the running variable is continuous at the cutoff. A significant discontinuity would indicate that households strategically manipulated their predicted income score to gain PANES eligibility — which would invalidate local randomisation.

Figure 4
McCrary Test — Density of Predicted Income Score at the Cutoff
McCrary density test and continuous histogram of running variable

Top: continuous histogram of predicted income scores. Bottom: McCrary test — local polynomial density estimates on each side with 95% CIs (red/blue). CIs overlap at zero. p-value: 0.4111 — no evidence of manipulation.

Step 3: Placebo Regressions on Covariates

A valid RDD requires that only the outcome — not pre-treatment characteristics — jumps at the cutoff. The table below regresses each baseline covariate on treatment status (being PANES-eligible). Significant coefficients would threaten the randomisation assumption.

TABLE 1 — Placebo Regression with Baseline Characteristics
Dependent Variable (2005 baseline) Coefficient
(std. error)
Observations
1. Respondent is female -0.025
(0.038)
2,231
2. Mean household size -0.273**
(0.122)
3,098
3. Household average age -1.194
(1.29)
2,232
4. Respondent age -0.92
(1.242)
2,231
5. Respondent years of education 0.228
(0.227)
2,206
6. Respondent voted in 2004 elections 0.0310
(0.024)
2,200
7. Log per capita income -0.061
(0.055)
2,150
OLS with robust standard errors. *** p<0.01, ** p<0.05, * p<0.10. Mean household size is the only covariate showing a significant jump (p<0.05) and is included as a control in subsequent models.

Six of seven covariates show no significant jump at the cutoff, supporting the validity of the RDD. Mean household size is the exception (coefficient -0.273**, suggesting PANES-eligible households are smaller), which may reflect the income score prediction formula's weighting of household composition. To be conservative, all subsequent models include household size as a control variable.

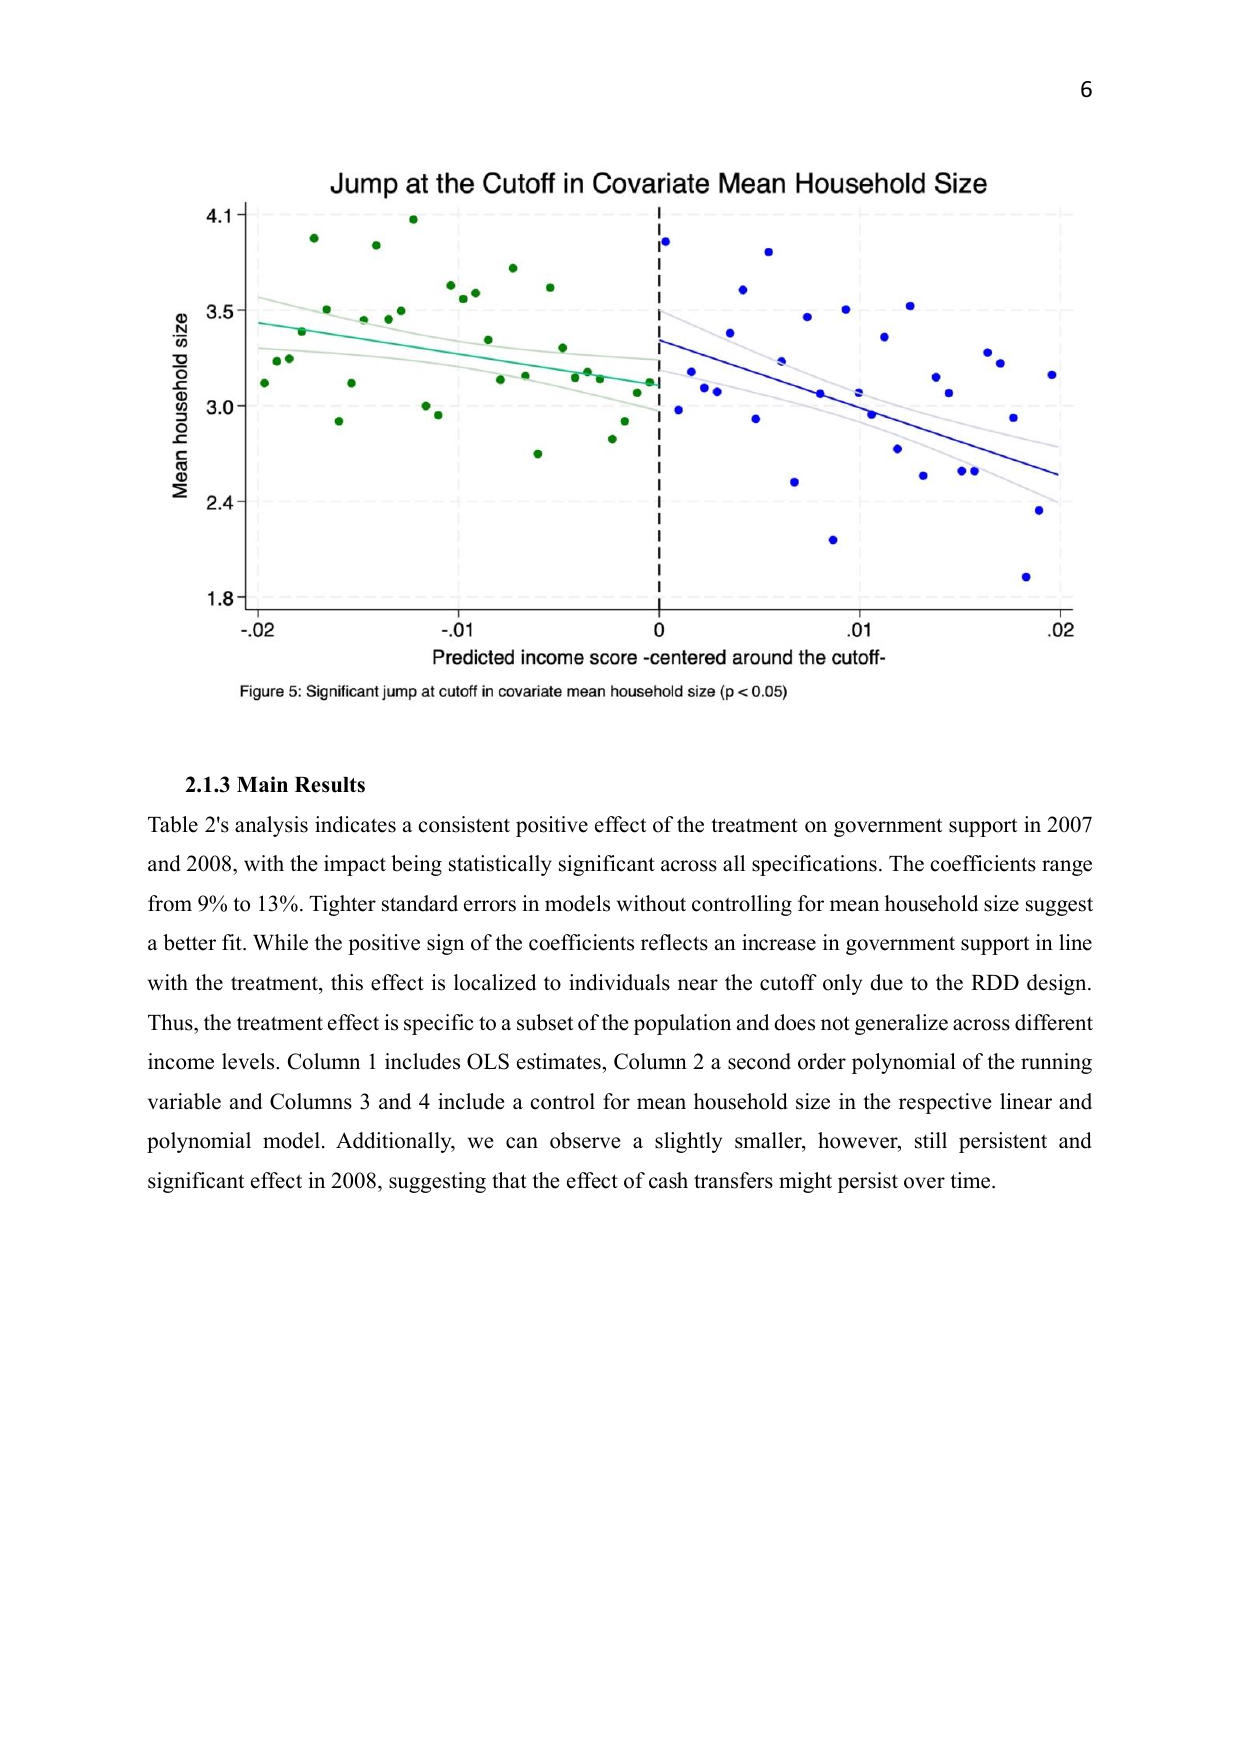
Figure 5
Jump at the Cutoff in Covariate Mean Household Size
Scatter plot showing jump at cutoff in covariate mean household size

Binned means of household size by predicted income score with linear fits on each side. A visible drop at the cutoff confirms the significant jump (–0.273**) detected in Table 1, motivating its inclusion as a control variable.

Step 4: Main Results

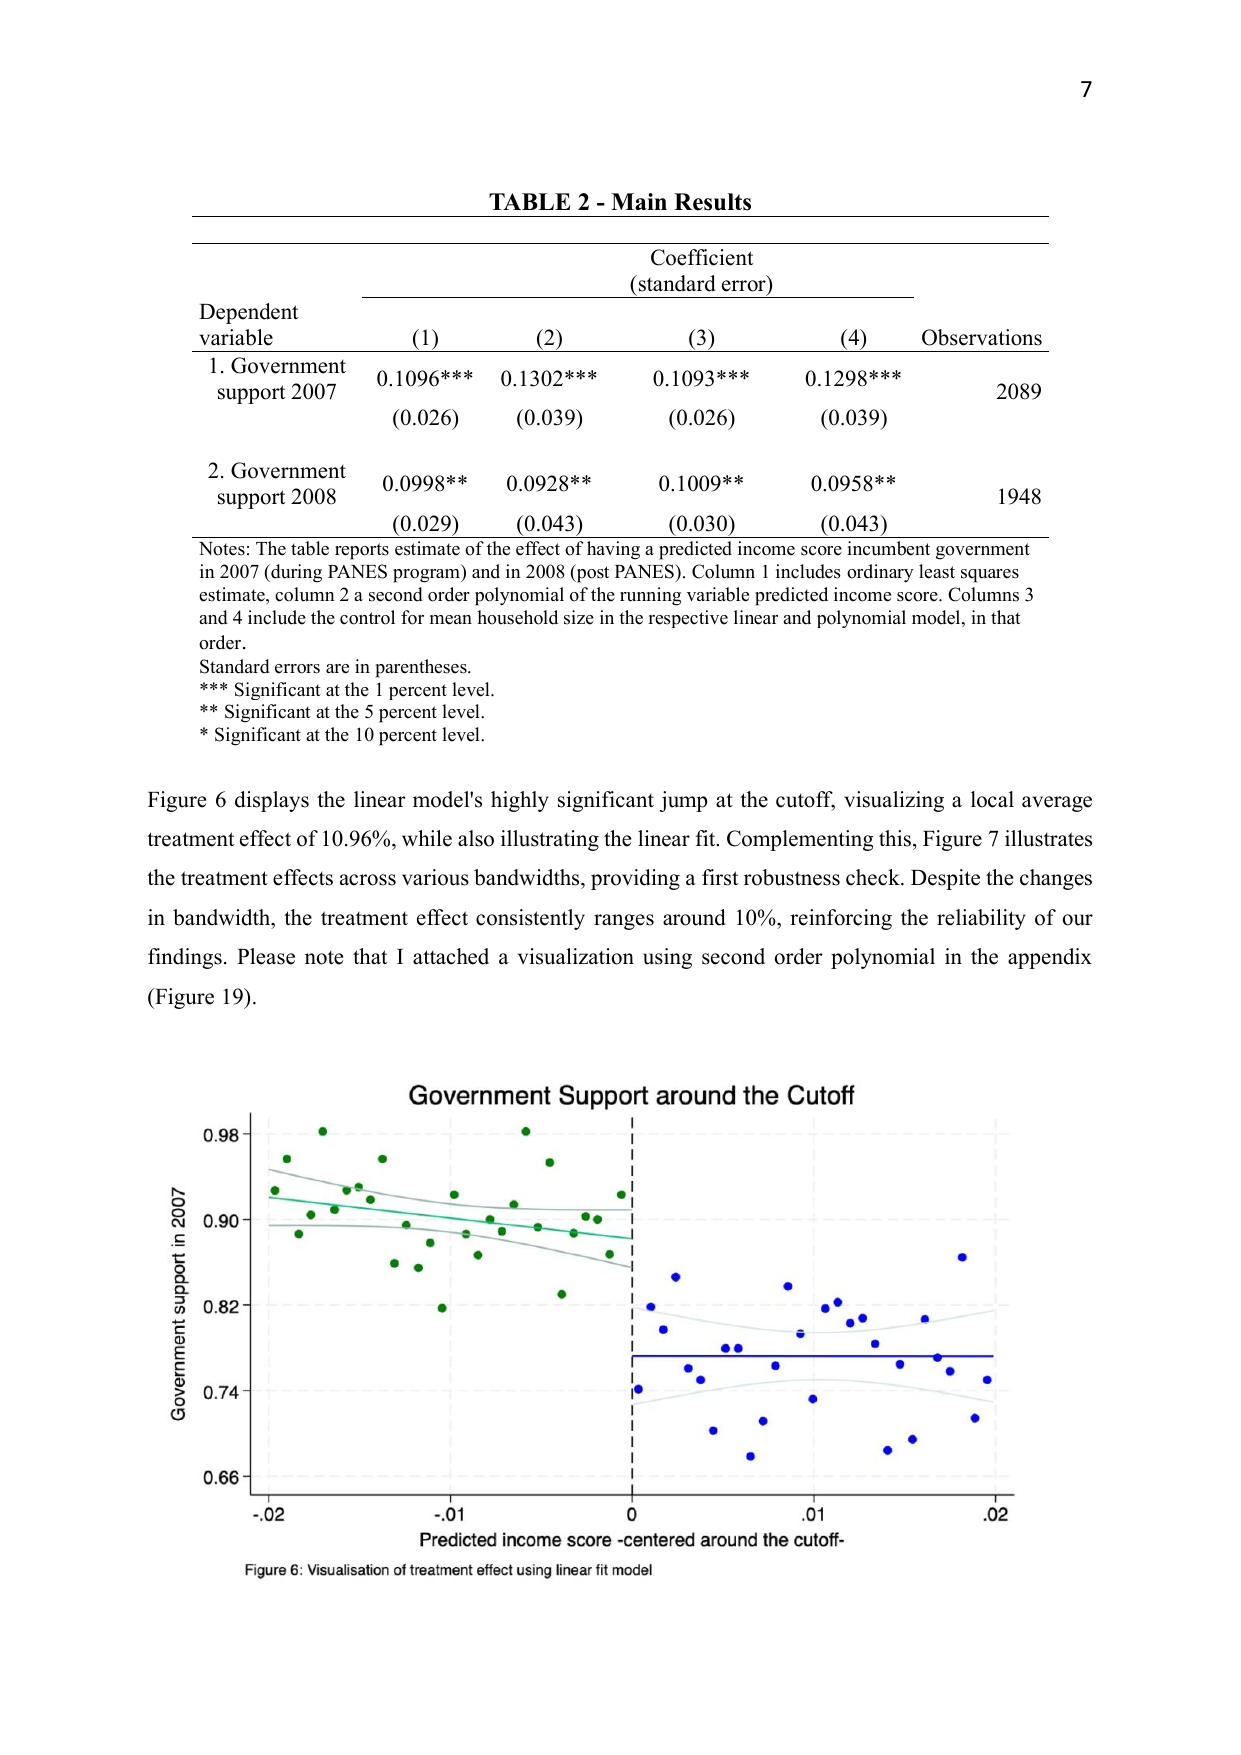
The main regressions estimate the causal effect of PANES eligibility on self-reported government support. Four specifications are reported: OLS linear (1), second-order polynomial (2), OLS linear with household-size control (3), and polynomial with control (4).

TABLE 2 — Main Results: Effect of PANES Eligibility on Government Support
Dependent Variable (1)
OLS Linear
(2)
Polynomial
(3)
OLS + Control
(4)
Poly + Control
N
1. Government support 2007
(during PANES)
0.1096***
(0.026)
0.1302***
(0.039)
0.1093***
(0.026)
0.1298***
(0.039)
2,089
2. Government support 2008
(post-PANES)
0.0998**
(0.029)
0.0928**
(0.043)
0.1009**
(0.030)
0.0958**
(0.043)
1,948
OLS estimates. Columns 1–2 include no controls; Columns 3–4 add a control for mean household size. Standard errors in parentheses. *** p<0.01, ** p<0.05, * p<0.10.

The effect is consistent and significant across all four specifications. The treatment effect ranges from 9.3–13%. Tighter standard errors in linear models reflect a better fit near the cutoff. Notably, the effect persists into 2008 (post-PANES), suggesting that political loyalty induced by cash transfers does not immediately dissipate once the programme ends.

Figure 6
Government Support around the Cutoff (Linear Fit)
RDD scatter plot showing government support jump at PANES eligibility cutoff

Binned mean government support (2007) against the centred income score. Green dots (PANES-eligible) cluster around 0.88–0.98; blue dots (ineligible) around 0.74–0.84. The gap at zero visualises the ~10.96% treatment effect.

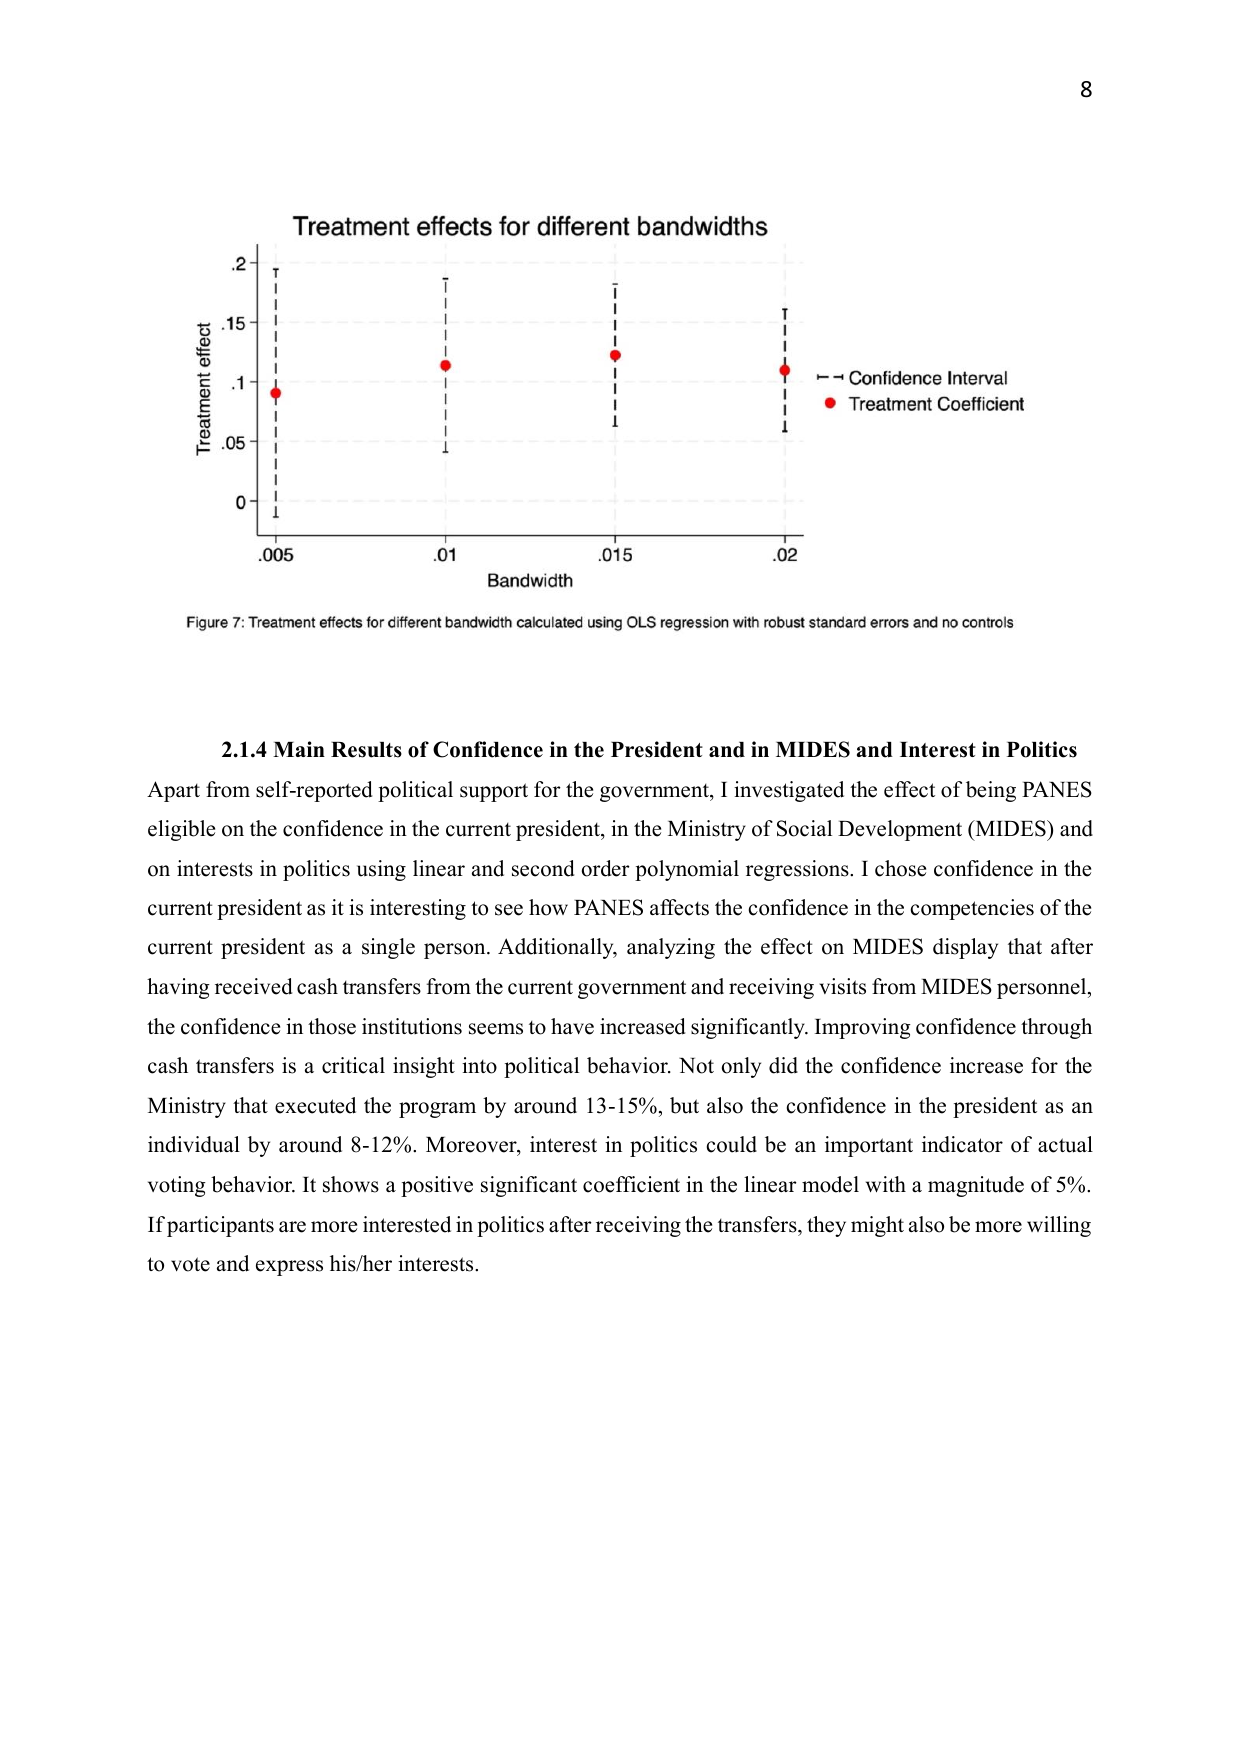
Figure 7
Bandwidth Sensitivity — Treatment Effects Across Bandwidths (OLS)
Treatment effects for different bandwidths with confidence intervals

OLS treatment coefficient and 95% CI at bandwidths of 0.005, 0.01, 0.015, and 0.02. Coefficients are stable (0.10–0.13) and CIs consistently exclude zero — the result is not an artefact of bandwidth choice.

Step 4b: Political Behaviour — Confidence & Interest

Beyond overall government support, I estimated the effect on confidence in the current president, confidence in the Ministry of Social Development (MIDES, the agency that administered PANES), and self-reported interest in politics. These provide a richer picture of how welfare transfers shape political behaviour.

TABLE 3 — Effect on Confidence in President, MIDES, and Interest in Politics
Dependent Variable (1) OLS Linear (2) Polynomial N
1. Confidence in the current president 0.0821**
(0.035)
0.1201**
(0.055)
1,937
2. Confidence in Ministry of Social Development (MIDES) 0.1515***
(0.036)
0.1336**
(0.055)
1,805
3. Interest in politics 0.0564**
(0.028)
0.0191
(0.044)
2,045
OLS estimates. Standard errors in parentheses. *** p<0.01, ** p<0.05, * p<0.10.

PANES eligibility raised confidence in the Ministry of Social Development by 13–15% and in the president personally by 8–12%. The significant effect on interest in politics (linear model) suggests that cash transfers may also activate political participation — not merely shift support toward the incumbent. If recipients become more interested in politics, they may be more likely to vote, translating self-reported support into actual electoral outcomes.

Steps 5–6: Robustness Checks

Donut-Hole Regression (±0.005 exclusion)

Observations within ±0.005 of the cutoff are excluded to test whether the result depends on observations most susceptible to near-cutoff heaping or measurement error.

TABLE 4 — Donut-Hole Regression (Donut = ±0.005)
Dependent Variable (1) (2) (3) (4) N
1. Government support 2007 0.1157**
(0.045)
0.3216**
(0.131)
0.1156**
(0.045)
0.3225**
(0.131)
1,600
2. Government support 2008 0.1379**
(0.055)
0.4480***
(0.158)
0.1377**
(0.055)
0.4488***
(0.158)
1,486
Columns 1–2: linear and polynomial, no controls. Columns 3–4: same with household size control. *** p<0.01, ** p<0.05. Observation counts reduced by excluded near-cutoff data.

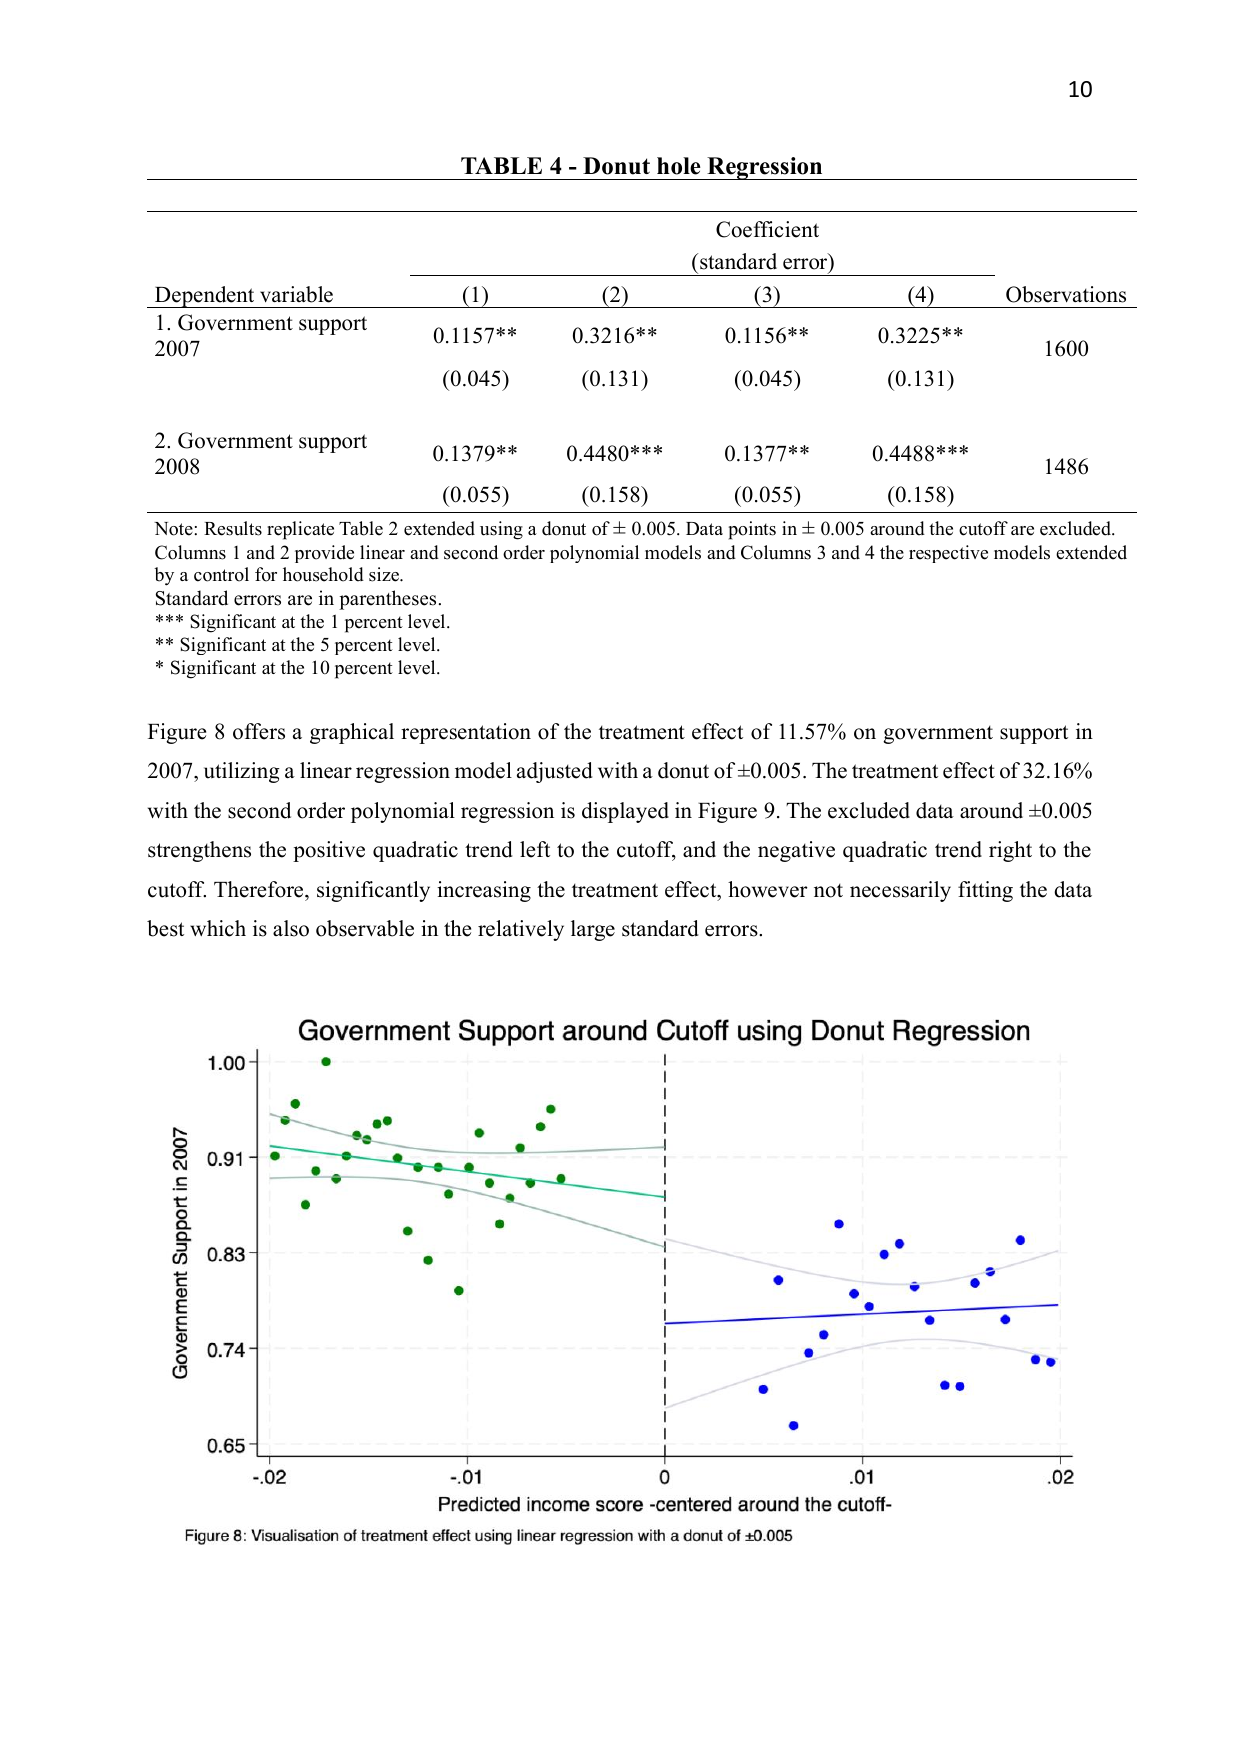
Results remain significant and the linear coefficients are slightly larger than in the main analysis. The inflated polynomial coefficients (0.32–0.45) suggest that near-cutoff observations slightly suppress the quadratic estimate — a key finding of this extension. The core result of a 10%+ treatment effect is unaffected by removing near-cutoff observations.

Figure 8
Donut Regression — Linear Fit (±0.005 exclusion)
Donut regression scatter plot with ±0.005 exclusion zone around cutoff

Near-cutoff observations excluded (±0.005). The gap at zero remains clearly visible — 11.57% linear effect. Empty band around zero shows the exclusion zone.

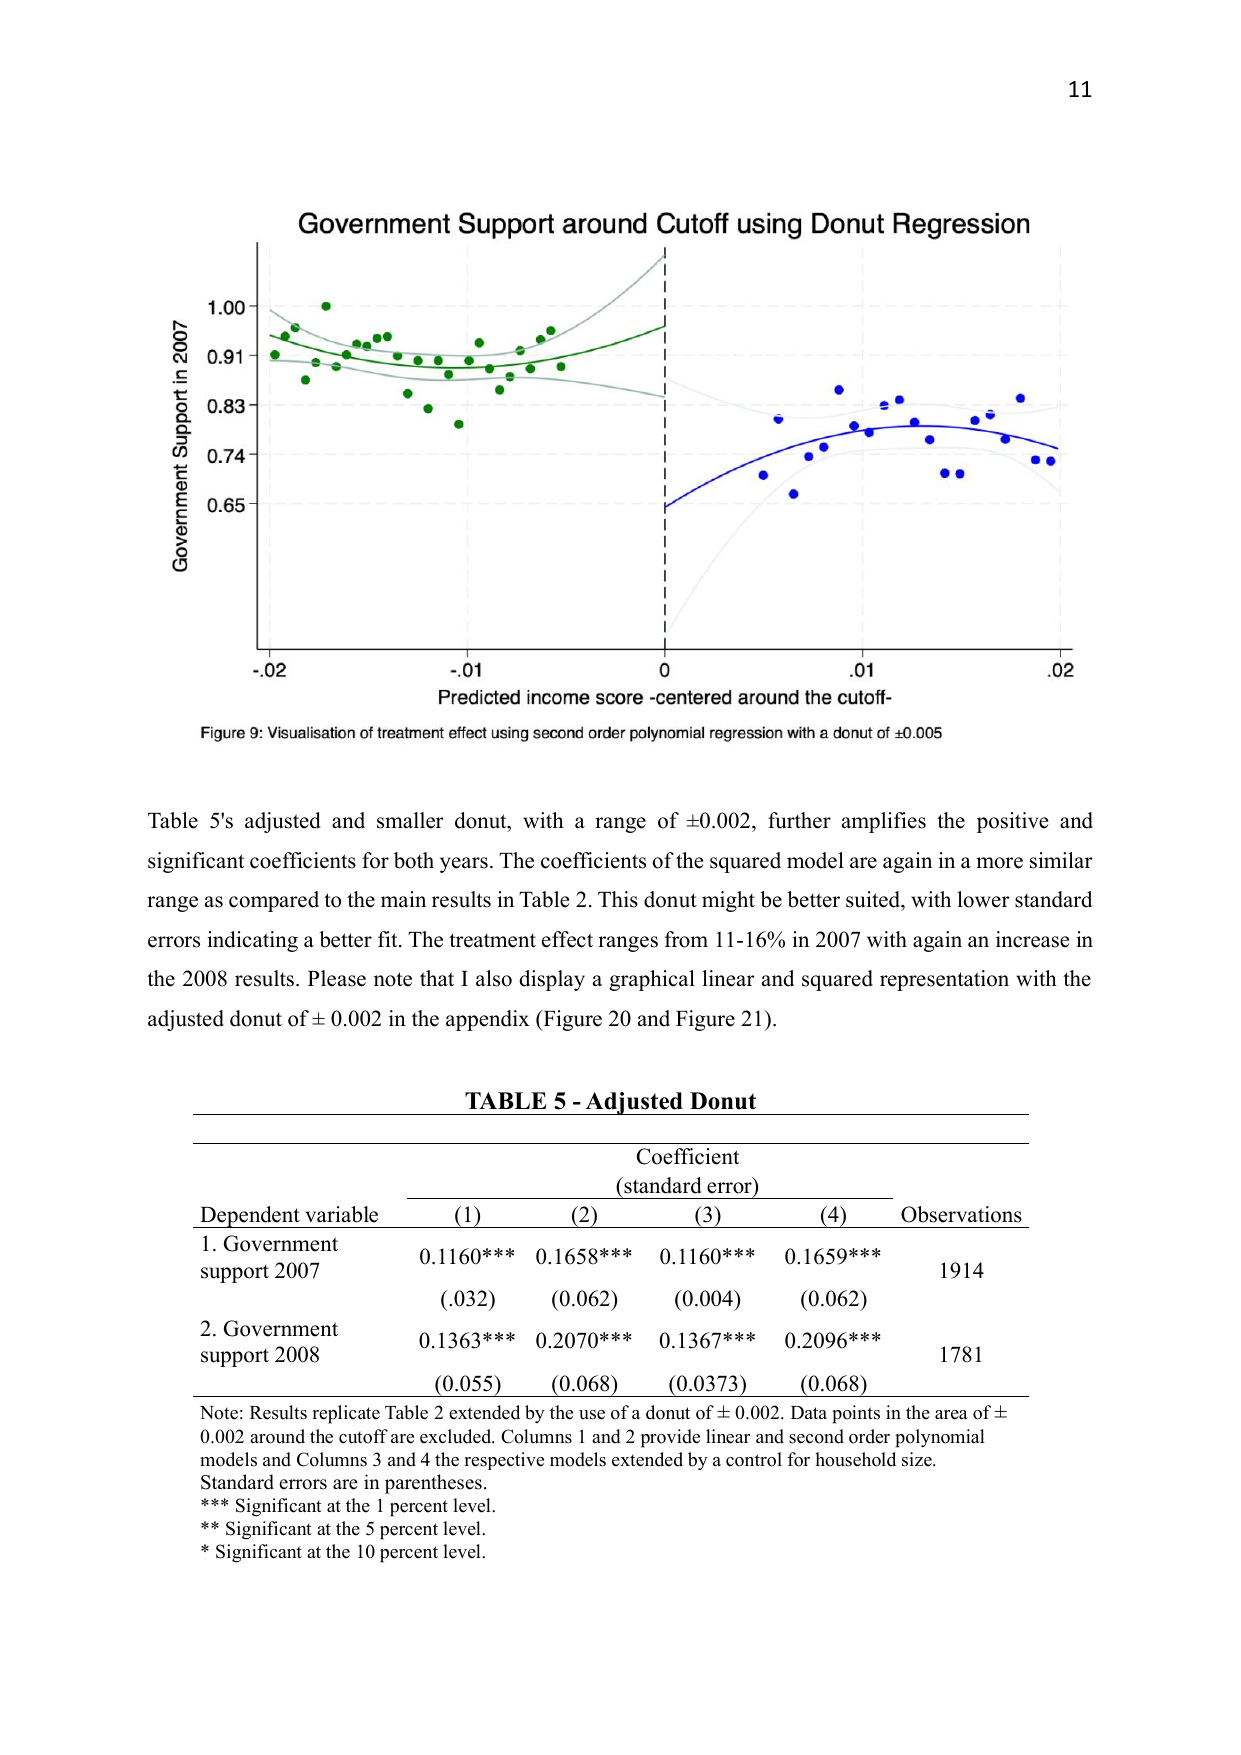
Figure 9
Donut Regression — Polynomial Fit (±0.005 exclusion)
Donut regression with ±0.002 adjusted exclusion zone and polynomial fit

Adjusted donut (±0.002) with second-order polynomial. Tighter exclusion zone balances robustness with statistical power — all four specifications remain significant at p<0.01.

Adjusted Donut Regression (±0.002 exclusion)

A narrower donut of ±0.002 balances robustness to near-cutoff heaping with preserving statistical power.

TABLE 5 — Adjusted Donut (Donut = ±0.002)
Dependent Variable (1) (2) (3) (4) N
1. Government support 2007 0.1160***
(0.032)
0.1658***
(0.062)
0.1160***
(0.004)
0.1659***
(0.062)
1,914
2. Government support 2008 0.1363***
(0.055)
0.2070***
(0.068)
0.1367***
(0.0373)
0.2096***
(0.068)
1,781
*** p<0.01. Narrower donut preserves more power while still excluding the most manipulation-prone observations.

With the adjusted donut, all four specifications achieve 1% significance for both years — stronger evidence than the main results. Polynomial coefficients settle at 16–21%, closer to the main estimates than the ±0.005 donut. This suggests the ±0.002 donut provides the best balance between robustness and precision, and that the true treatment effect is conservatively around 10–17%.

Local Polynomial Regressions (rdrobust, Epanechnikov kernel)

Nonparametric local polynomial regression using the rdrobust Stata package with bias-corrected inference. This approach uses data-driven bandwidth selection (MSERD and MSETWO) and an Epanechnikov kernel that down-weights observations further from the cutoff.

TABLE 6 — Local Polynomials (symmetric & asymmetric bandwidths)
Dependent Variable (1) MSERD
(symmetric)
(2) MSETWO
(asymmetric)
(3) Full bandwidth
(±0.002)
1. Government support 2007 0.1770**
(0.087)
0.1697**
(0.085)
0.1255***
(0.040)
2. Government support 2008 -0.0587
(0.077)
-0.0927
(0.091)
0.0614
(0.044)
Second order local polynomial with Epanechnikov kernel. *** p<0.01, ** p<0.05. MSERD = mean square error optimal symmetric bandwidth. MSETWO = MSE optimal asymmetric bandwidth. 2008 results are mixed and should be interpreted with caution.
TABLE 7 — Local Polynomials with Donut (±0.002)
Dependent Variable (1) MSERD (2) MSETWO (3) Full bandwidth
1. Government support 2007 0.0564
(0.1818)
0.1125
(0.139)
0.1658***
(0.0598)
2. Government support 2008 0.0250
(0.178)
0.0320
(0.191)
0.2070***
(0.069)
Uniform kernel used with donut (Epanechnikov not suitable when near-cutoff data is excluded). *** p<0.01. Narrower bandwidths lose significance due to combined power reduction from donut + small bandwidth.

The 2007 local polynomial results are consistent with the OLS findings: a 12.5–17.7% effect depending on bandwidth. The mixed 2008 local polynomial results warrant caution — the post-PANES persistence found in OLS is less robust to the nonparametric approach, particularly with narrower bandwidths.

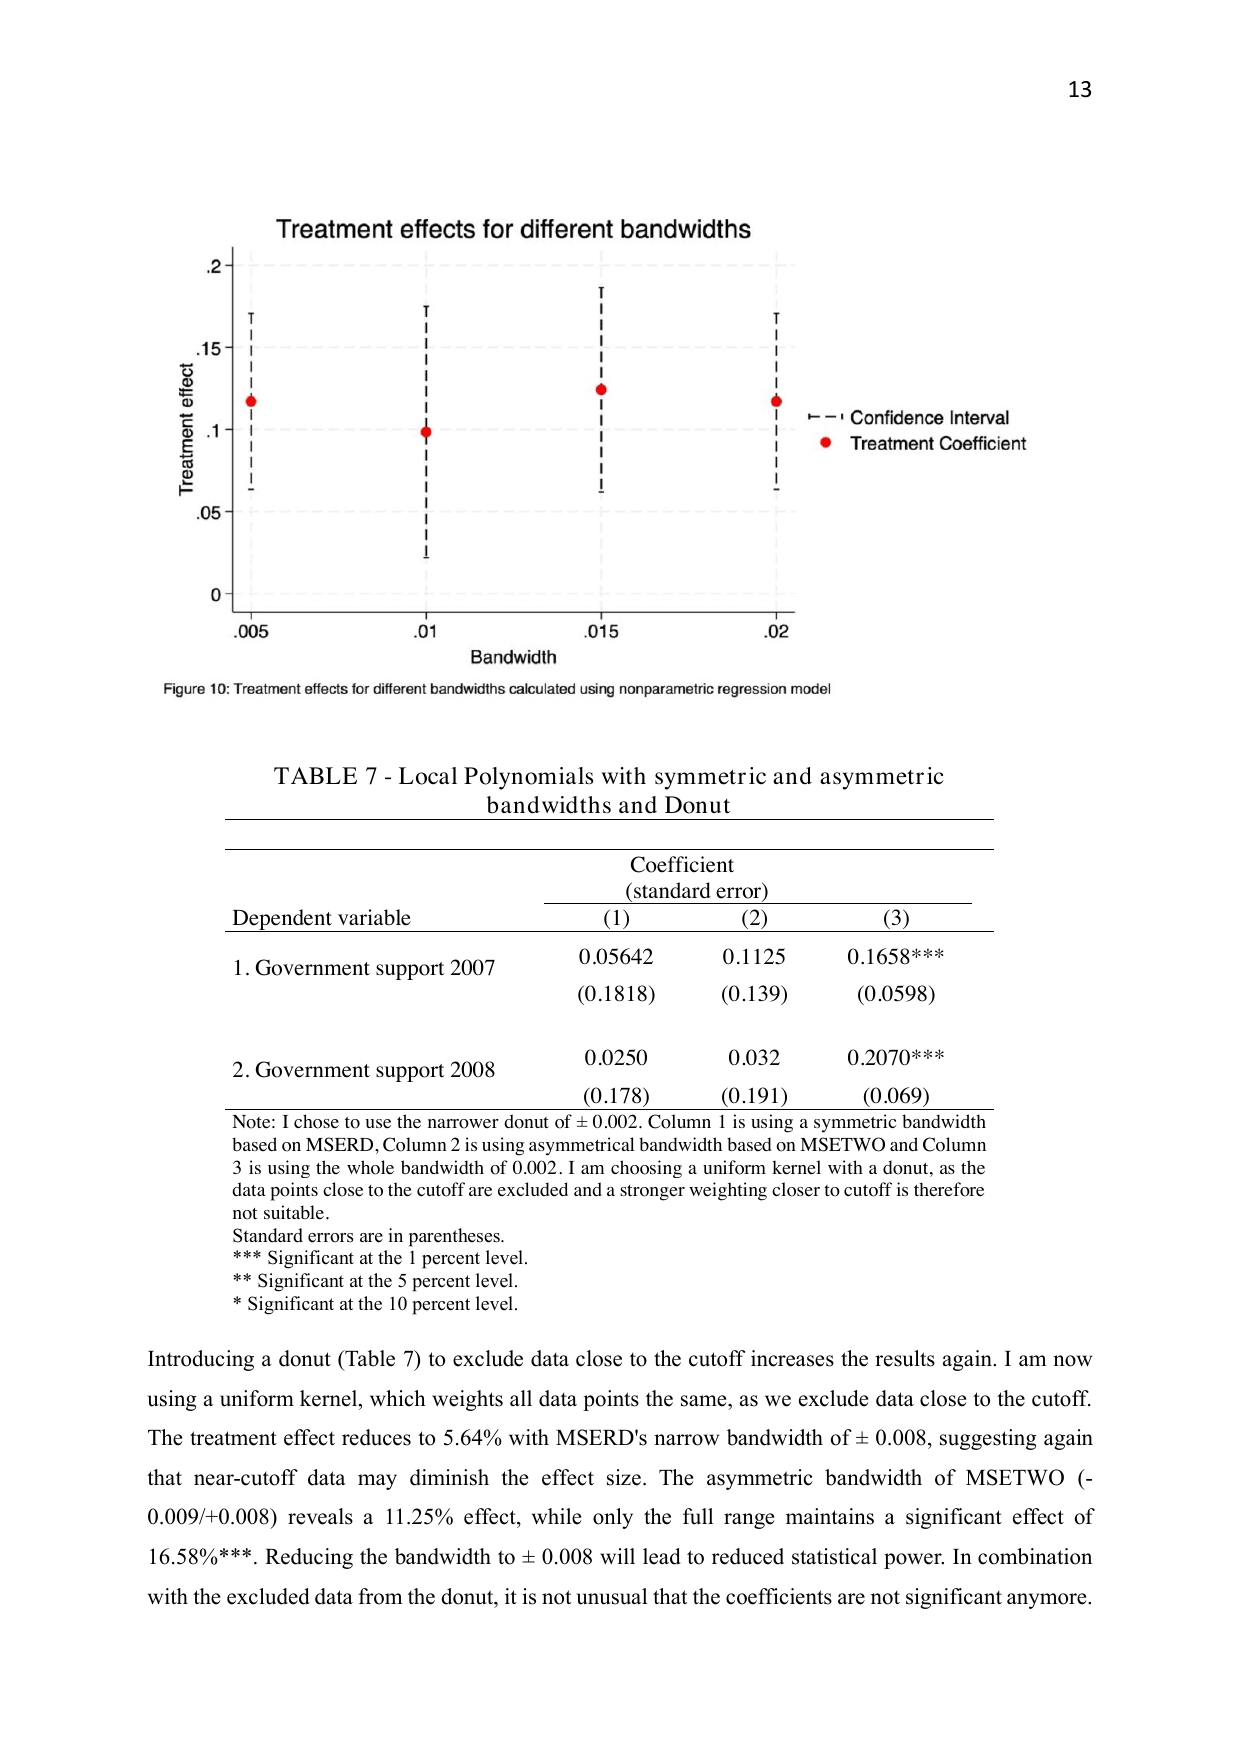
Figure 10
Bandwidth Sensitivity — Local Polynomial Treatment Coefficients
Local polynomial treatment effects for different bandwidths

Second-order local polynomial treatment coefficients and 95% CIs across four bandwidth choices. Coefficients are stable around 0.10–0.13 with no systematic drift — confirms the nonparametric result is not bandwidth-sensitive.

Graphical Presentations (rdplot & cmogram)

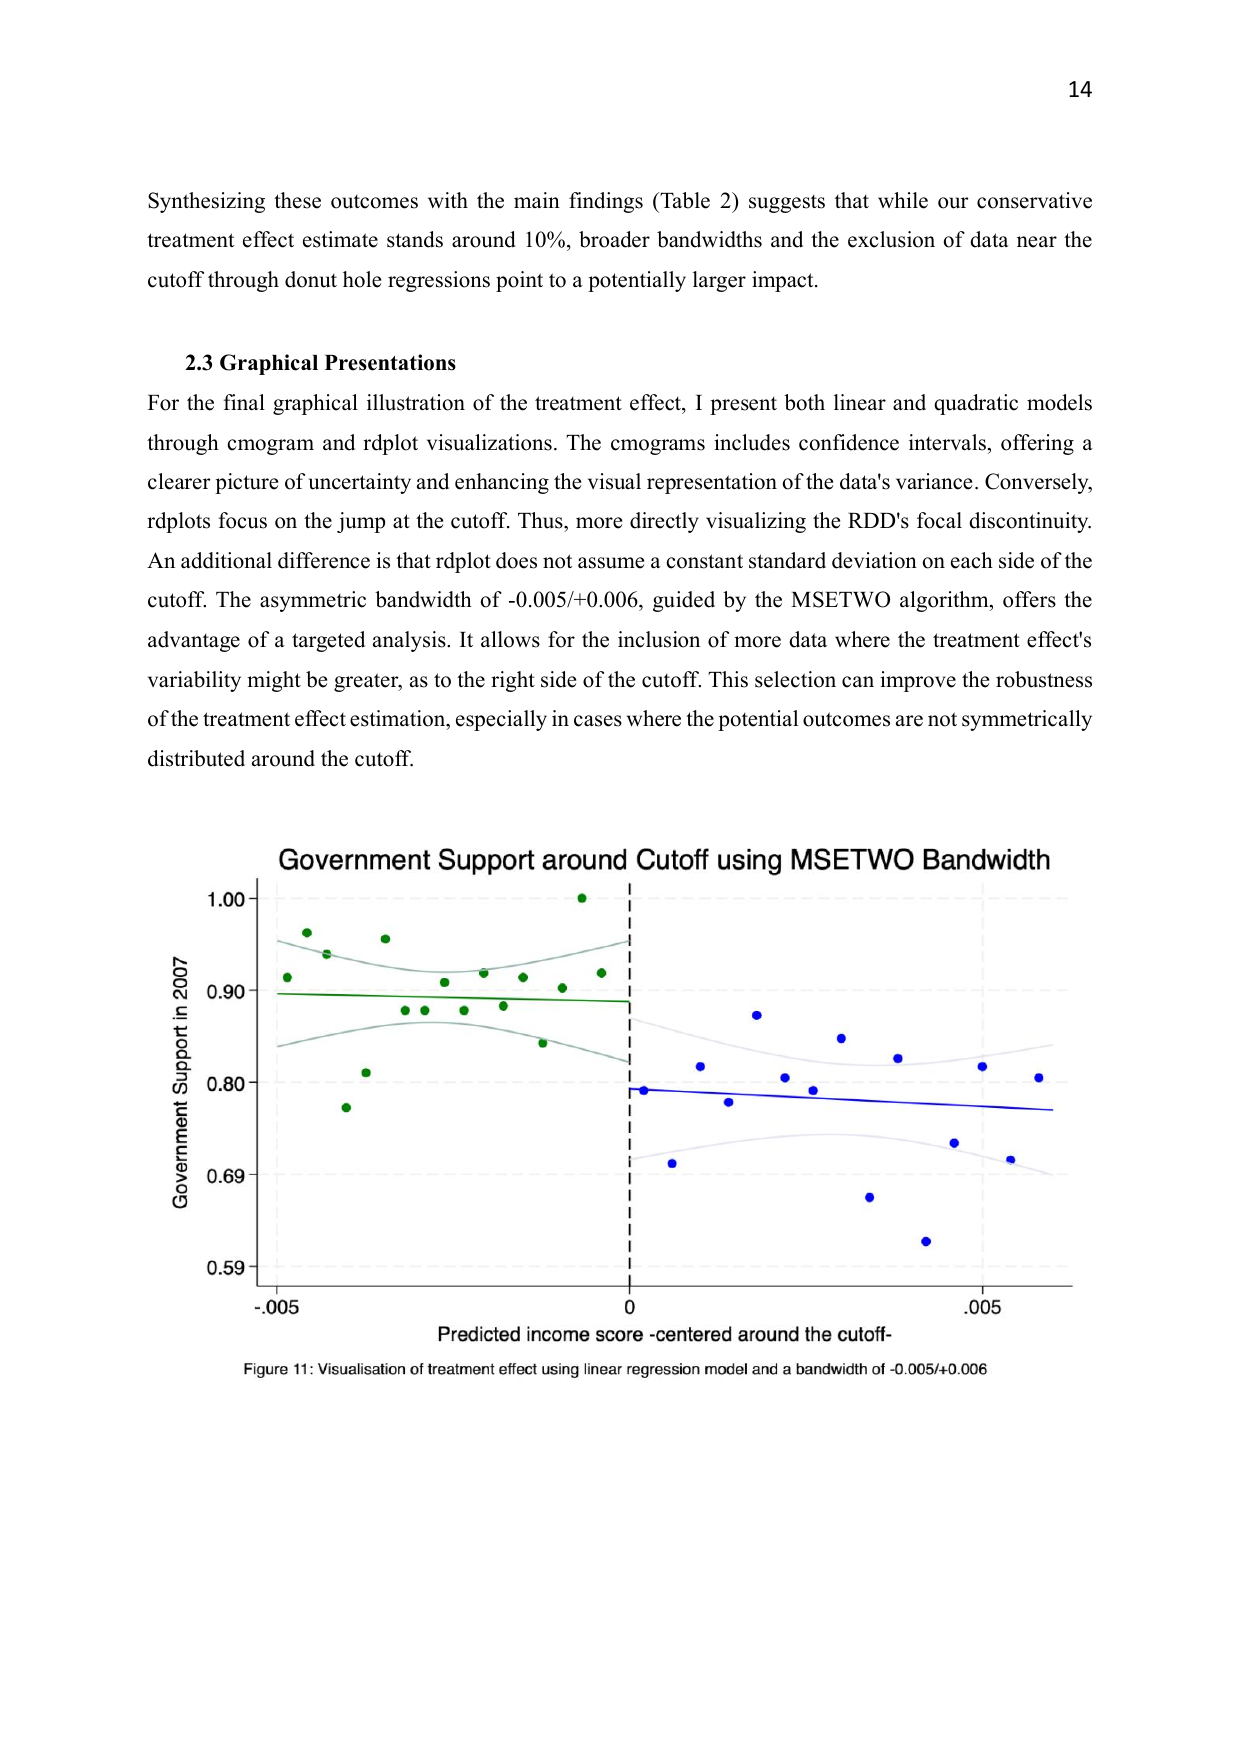
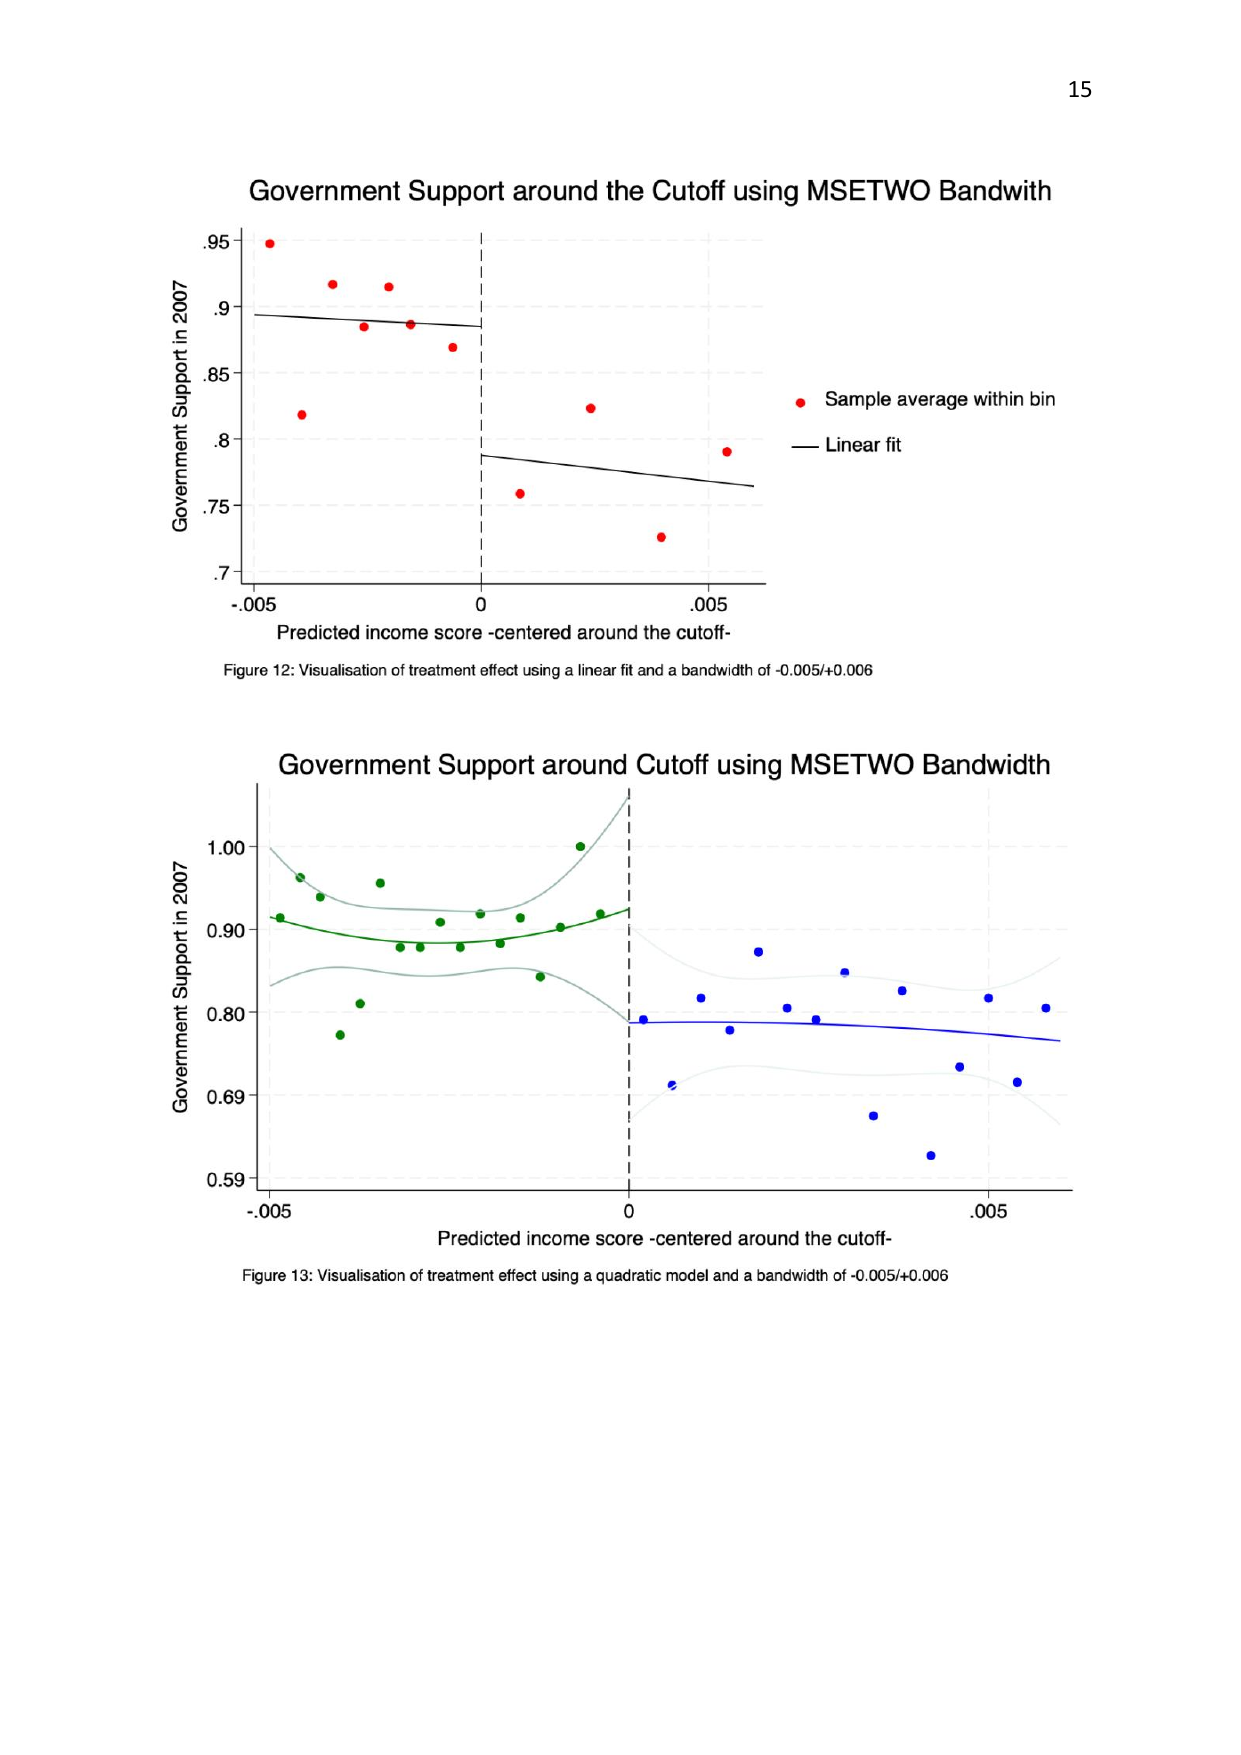
The final graphical analysis uses cmogram and rdplot Stata commands to present the treatment effect with alternative visualisation approaches. Cmograms show confidence intervals; rdplot focuses on the discontinuity at the cutoff without assuming a constant standard deviation on each side.

Figure 11
Government Support — MSETWO Bandwidth, Linear
Government support around cutoff using MSETWO asymmetric bandwidth linear model

MSETWO asymmetric bandwidth (–0.005/+0.006), linear regression. Jump at the cutoff remains clearly visible with confidence intervals.

Figures 12–14
rdplot: Linear and Polynomial Fits at MSETWO Bandwidth
rdplot visualisations with linear and quadratic fits at MSETWO bandwidth

rdplot with linear (top) and quadratic (bottom) fits at MSETWO bandwidth. Both show a consistent gap at the cutoff, confirming the regression estimates graphically.

Critical Assessment & Policy Implications

Methodological Limitations

External Validity: LATE is Local

The RDD identifies the treatment effect only for households near the poverty threshold — the Local Average Treatment Effect (LATE). This cannot be extrapolated to households well below the poverty line or to wealthier populations. The external validity to other countries with different political institutions is also limited.

Internal Validity: Contact Effects

PANES eligibility brought not just cash, but visits from MIDES personnel and increased contact with government officials. Positive social interaction with government representatives could independently shift political support, confounding the pure cash transfer effect with a contact and information effect.

Self-Reported Support vs. Voting Behaviour

The outcome is self-reported political support, not actual votes. Social desirability bias may inflate the effect if PANES recipients felt pressure to express gratitude. Low voter turnout among low-income groups further limits the programme's potential electoral impact.

Heaping in the Running Variable

Histograms revealed some heaping in predicted income scores, even if not directly at the cutoff. Following Barreca, Lindo & Waddell (2016), distant heaping can still bias estimates, which is why donut-hole regressions were implemented as the primary robustness check.


Policy Implications

The finding that cash transfers increase political support, confidence in the implementing ministry, and interest in politics has several implications for policy design:

  • Well-designed anti-poverty programmes with visible government branding can generate political dividends beyond their direct welfare impact
  • The persistence of the effect into 2008 (post-PANES) suggests that loyalty effects from welfare transfers are not purely transactional — they may reflect genuine shifts in political attitudes
  • The large effect on MIDES confidence (13–15%) implies that how transfers are delivered matters: personal contact with government personnel amplifies political effects beyond the monetary benefit alone
  • Policymakers in other countries should not assume these magnitudes generalise: Uruguay in 2005–07 was a distinctive context — a newly elected left-wing government implementing its first major social programme

Extension: Bandwidth Analysis

The original Manacorda et al. (2011) paper does not include a bandwidth sensitivity analysis — a significant gap, given that bandwidth selection is one of the most consequential analytical choices in RDD. This report fills that gap by systematically reporting treatment effects at four bandwidths (0.005, 0.01, 0.015, 0.02) for three estimators: OLS, second-order polynomial, and local polynomial (rdrobust).

All three estimators produce bandwidth-stable results for 2007, with coefficients consistently in the 9–13% range and confidence intervals excluding zero throughout. This provides the strongest possible evidence that the treatment effect is not a statistical artifact of a particular bandwidth choice. The conservative estimate of ~10% political support gain from PANES eligibility stands as the primary conclusion.

The 2008 local polynomial results are more mixed, raising legitimate questions about the long-run persistence of the effect. The OLS evidence for persistence is stronger, but future work with larger datasets and wider bandwidths would be needed to resolve this definitively.